|
Download Data (XLS File) |
|
||||||||
|
||||||||
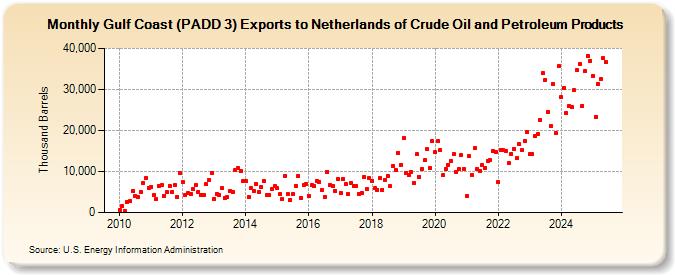
| Gulf Coast (PADD 3) Exports to Netherlands of Crude Oil and Petroleum Products (Thousand Barrels) | ||||||||
| Year | Jan | Feb | Mar | Apr | May | Jun | Jul | Aug | Sep | Oct | Nov | Dec |
|---|---|---|---|---|---|---|---|---|---|---|---|---|
| 2010 | 680 | 1,539 | 422 | 2,631 | 2,700 | 5,298 | 4,132 | 3,815 | 5,088 | 7,255 | 8,447 | 5,996 |
| 2011 | 6,290 | 4,164 | 3,207 | 6,541 | 6,595 | 4,146 | 4,981 | 6,537 | 5,027 | 6,686 | 3,905 | 9,628 |
| 2012 | 7,532 | 4,162 | 4,701 | 4,601 | 5,703 | 6,760 | 5,097 | 4,164 | 4,273 | 6,863 | 7,834 | 9,634 |
| 2013 | 3,332 | 4,590 | 4,264 | 5,882 | 3,463 | 3,719 | 5,244 | 5,092 | 10,303 | 10,872 | 10,142 | 7,638 |
| 2014 | 7,657 | 3,759 | 5,879 | 5,210 | 6,969 | 5,074 | 6,186 | 7,665 | 4,222 | 4,268 | 5,847 | 6,352 |
| 2015 | 5,919 | 4,451 | 3,356 | 8,818 | 4,412 | 3,172 | 4,533 | 6,565 | 8,993 | 3,607 | 6,675 | 7,061 |
| 2016 | 4,133 | 6,611 | 6,512 | 7,740 | 7,497 | 5,491 | 3,896 | 9,987 | 6,740 | 6,574 | 5,261 | 8,124 |
| 2017 | 4,788 | 8,178 | 6,947 | 4,426 | 7,272 | 6,558 | 6,455 | 4,488 | 4,857 | 8,737 | 5,735 | 8,334 |
| 2018 | 7,782 | 5,910 | 5,500 | 8,326 | 5,588 | 8,016 | 8,872 | 6,366 | 11,390 | 10,416 | 14,573 | 11,686 |
| 2019 | 18,150 | 9,758 | 9,050 | 9,991 | 7,257 | 14,168 | 8,783 | 10,707 | 12,710 | 15,415 | 10,776 | 17,335 |
| 2020 | 14,646 | 17,465 | 15,208 | 9,044 | 10,670 | 11,683 | 12,573 | 14,177 | 9,969 | 10,607 | 14,012 | 10,644 |
| 2021 | 4,102 | 13,685 | 9,218 | 15,666 | 10,607 | 10,136 | 11,500 | 10,752 | 12,627 | 12,715 | 15,018 | 14,726 |
| 2022 | 7,418 | 15,243 | 15,207 | 14,943 | 12,116 | 14,326 | 15,533 | 13,265 | 16,688 | 15,257 | 17,377 | 19,537 |
| 2023 | 18,008 | 13,323 | 26,367 | 20,420 | 22,363 | 33,556 | 33,304 | 21,562 | 21,972 | 31,343 | 21,381 | 33,810 |
| 2024 | 34,549 | |||||||||||
| - = No Data Reported; -- = Not Applicable; NA = Not Available; W = Withheld to avoid disclosure of individual company data. |
| Release Date: 3/29/2024 |
| Next Release Date: 4/30/2024 |