|
Download Data (XLS File) |
|
||||||||
|
||||||||
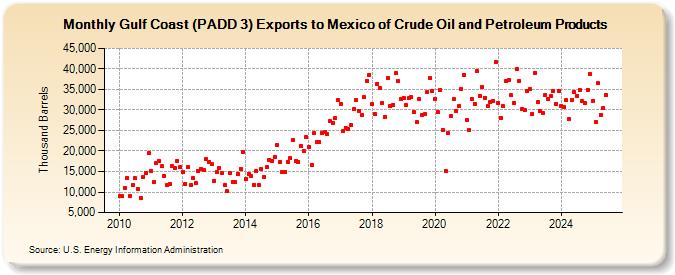
| Gulf Coast (PADD 3) Exports to Mexico of Crude Oil and Petroleum Products (Thousand Barrels) | ||||||||
| Year | Jan | Feb | Mar | Apr | May | Jun | Jul | Aug | Sep | Oct | Nov | Dec |
|---|---|---|---|---|---|---|---|---|---|---|---|---|
| 2010 | 8,965 | 8,935 | 11,009 | 13,455 | 9,146 | 11,721 | 13,396 | 10,687 | 8,658 | 13,670 | 14,666 | 19,408 |
| 2011 | 15,164 | 12,494 | 17,112 | 17,599 | 16,243 | 13,931 | 11,678 | 11,990 | 16,326 | 15,885 | 17,611 | 15,989 |
| 2012 | 14,877 | 11,972 | 16,098 | 11,613 | 13,368 | 12,247 | 15,121 | 15,725 | 15,258 | 17,956 | 17,426 | 16,846 |
| 2013 | 12,724 | 14,833 | 15,812 | 14,689 | 11,601 | 10,220 | 14,632 | 12,495 | 12,354 | 14,510 | 15,707 | 19,681 |
| 2014 | 13,122 | 14,500 | 13,981 | 11,826 | 15,093 | 11,769 | 15,537 | 13,617 | 15,988 | 17,928 | 17,680 | 18,646 |
| 2015 | 21,422 | 17,382 | 14,841 | 14,996 | 17,384 | 18,227 | 22,725 | 17,455 | 17,400 | 21,319 | 19,911 | 23,430 |
| 2016 | 21,052 | 16,707 | 24,285 | 22,252 | 22,295 | 24,489 | 24,584 | 24,101 | 27,204 | 26,903 | 28,008 | 32,373 |
| 2017 | 31,543 | 24,816 | 25,715 | 25,314 | 26,242 | 30,172 | 32,351 | 29,842 | 28,710 | 33,150 | 37,079 | 38,631 |
| 2018 | 31,333 | 29,067 | 36,427 | 35,250 | 31,714 | 28,304 | 37,838 | 30,914 | 31,272 | 38,975 | 37,020 | 32,600 |
| 2019 | 32,981 | 31,086 | 32,798 | 33,070 | 29,550 | 26,983 | 32,789 | 28,835 | 28,906 | 34,469 | 37,887 | 34,646 |
| 2020 | 32,769 | 29,405 | 34,911 | 25,201 | 15,224 | 24,404 | 28,567 | 32,555 | 29,713 | 30,918 | 34,985 | 38,473 |
| 2021 | 27,660 | 25,101 | 32,667 | 31,452 | 39,420 | 33,413 | 35,609 | 32,983 | 30,972 | 31,881 | 32,117 | 41,729 |
| 2022 | 31,642 | 28,126 | 30,925 | 37,070 | 37,308 | 33,533 | 31,815 | 39,997 | 37,156 | 30,179 | 30,010 | 34,729 |
| 2023 | 33,450 | 30,620 | 40,972 | 30,079 | 29,462 | 30,056 | 34,150 | 31,912 | 33,663 | 34,463 | 31,211 | 34,582 |
| 2024 | 31,023 | 29,859 | 31,993 | 27,742 | ||||||||
| - = No Data Reported; -- = Not Applicable; NA = Not Available; W = Withheld to avoid disclosure of individual company data. |
| Release Date: 6/28/2024 |
| Next Release Date: 7/31/2024 |