|
Download Data (XLS File) |
|
||||||||
|
||||||||
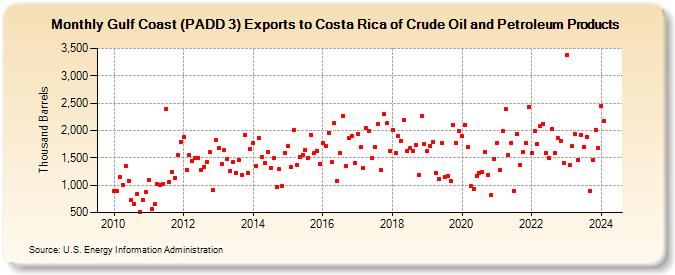
| Gulf Coast (PADD 3) Exports to Costa Rica of Crude Oil and Petroleum Products (Thousand Barrels) | ||||||||
| Year | Jan | Feb | Mar | Apr | May | Jun | Jul | Aug | Sep | Oct | Nov | Dec |
|---|---|---|---|---|---|---|---|---|---|---|---|---|
| 2010 | 902 | 888 | 1,153 | 1,008 | 1,359 | 1,079 | 733 | 662 | 838 | 506 | 725 | 873 |
| 2011 | 1,103 | 559 | 662 | 1,028 | 995 | 1,028 | 2,391 | 1,064 | 1,238 | 1,138 | 1,552 | 1,787 |
| 2012 | 1,883 | 1,278 | 1,546 | 1,451 | 1,494 | 1,497 | 1,282 | 1,339 | 1,427 | 1,602 | 908 | 1,831 |
| 2013 | 1,680 | 1,395 | 1,637 | 1,480 | 1,261 | 1,420 | 1,230 | 1,463 | 1,184 | 1,912 | 1,230 | 1,667 |
| 2014 | 1,774 | 1,355 | 1,869 | 1,512 | 1,401 | 1,613 | 1,310 | 1,492 | 960 | 1,288 | 987 | 1,594 |
| 2015 | 1,716 | 1,329 | 2,008 | 1,365 | 1,515 | 1,545 | 1,640 | 1,503 | 1,916 | 1,592 | 1,633 | 1,391 |
| 2016 | 1,768 | 1,720 | 1,961 | 1,422 | 2,130 | 1,079 | 1,582 | 2,258 | 1,355 | 1,857 | 1,895 | 1,413 |
| 2017 | 1,941 | 1,697 | 1,308 | 2,039 | 1,984 | 1,501 | 1,701 | 2,118 | 1,273 | 2,304 | 2,130 | 1,622 |
| 2018 | 2,010 | 1,583 | 1,895 | 1,806 | 2,195 | 1,629 | 1,675 | 1,621 | 1,738 | 1,183 | 2,267 | 1,744 |
| 2019 | 1,627 | 1,717 | 1,785 | 1,225 | 1,115 | 1,771 | 1,148 | 1,173 | 1,074 | 2,095 | 1,770 | 1,982 |
| 2020 | 1,894 | 2,096 | 1,706 | 982 | 923 | 1,176 | 1,220 | 1,238 | 1,608 | 1,186 | 812 | 1,482 |
| 2021 | 1,777 | 1,276 | 1,982 | 2,387 | 1,551 | 1,778 | 900 | 1,944 | 1,362 | 1,615 | 1,768 | 2,436 |
| 2022 | 1,582 | 1,994 | 1,749 | 2,079 | 2,125 | 1,593 | 1,496 | 2,033 | 1,591 | 1,864 | 1,803 | 1,401 |
| 2023 | 3,372 | 1,361 | 1,708 | 1,937 | 1,469 | 1,918 | 1,689 | 1,881 | 902 | 1,465 | 2,015 | 1,676 |
| 2024 | 2,440 | |||||||||||
| - = No Data Reported; -- = Not Applicable; NA = Not Available; W = Withheld to avoid disclosure of individual company data. |
| Release Date: 3/29/2024 |
| Next Release Date: 4/30/2024 |