|
Download Data (XLS File) |
|
||||||||
|
||||||||
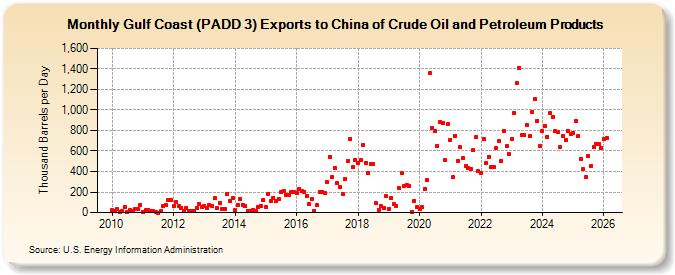
| Gulf Coast (PADD 3) Exports to China of Crude Oil and Petroleum Products (Thousand Barrels per Day) | ||||||||
| Year | Jan | Feb | Mar | Apr | May | Jun | Jul | Aug | Sep | Oct | Nov | Dec |
|---|---|---|---|---|---|---|---|---|---|---|---|---|
| 2010 | 22 | 11 | 30 | 10 | 17 | 59 | 7 | 21 | 18 | 31 | 36 | 74 |
| 2011 | 10 | 21 | 25 | 13 | 13 | 9 | 0 | 17 | 64 | 72 | 125 | 123 |
| 2012 | 67 | 100 | 62 | 48 | 17 | 47 | 19 | 18 | 19 | 47 | 88 | 52 |
| 2013 | 64 | 47 | 73 | 66 | 138 | 46 | 90 | 35 | 36 | 184 | 115 | 139 |
| 2014 | 26 | 74 | 133 | 78 | 60 | 14 | 13 | 26 | 19 | 52 | 66 | 120 |
| 2015 | 55 | 182 | 112 | 146 | 114 | 136 | 196 | 212 | 174 | 173 | 201 | 200 |
| 2016 | 194 | 230 | 209 | 205 | 160 | 81 | 129 | 20 | 71 | 205 | 204 | 190 |
| 2017 | 300 | 546 | 343 | 437 | 287 | 252 | 181 | 328 | 505 | 720 | 445 | 517 |
| 2018 | 482 | 512 | 661 | 486 | 383 | 469 | 476 | 90 | 26 | 60 | 46 | 160 |
| 2019 | 35 | 144 | 82 | 68 | 235 | 383 | 258 | 269 | 261 | 9 | 117 | 50 |
| 2020 | 37 | 58 | 226 | 315 | 1,356 | 828 | 793 | 653 | 887 | 868 | 517 | 864 |
| 2021 | 712 | 343 | 750 | 503 | 636 | 529 | 455 | 430 | 420 | 608 | 733 | 402 |
| 2022 | 389 | 719 | 481 | 541 | 444 | 440 | 625 | 694 | 502 | 794 | 648 | 573 |
| 2023 | 717 | 887 | 1,380 | 1,259 | 755 | 802 | 793 | 720 | 971 | 1,118 | 895 | 606 |
| 2024 | 777 | |||||||||||
| - = No Data Reported; -- = Not Applicable; NA = Not Available; W = Withheld to avoid disclosure of individual company data. |
| Release Date: 3/29/2024 |
| Next Release Date: 4/30/2024 |