|
Download Data (XLS File) |
|
||||||||
|
||||||||
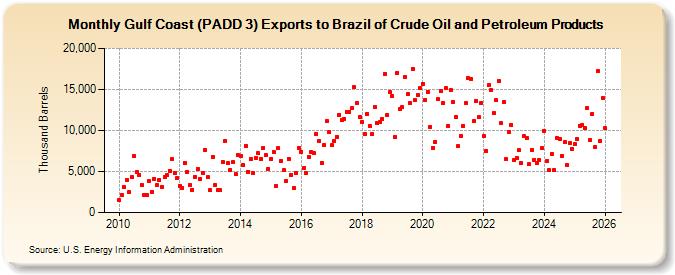
| Gulf Coast (PADD 3) Exports to Brazil of Crude Oil and Petroleum Products (Thousand Barrels) | ||||||||
| Year | Jan | Feb | Mar | Apr | May | Jun | Jul | Aug | Sep | Oct | Nov | Dec |
|---|---|---|---|---|---|---|---|---|---|---|---|---|
| 2010 | 1,513 | 2,172 | 3,104 | 3,985 | 2,450 | 4,311 | 6,869 | 4,916 | 4,617 | 3,362 | 2,080 | 2,084 |
| 2011 | 3,796 | 2,540 | 4,110 | 3,324 | 4,009 | 3,174 | 4,336 | 4,544 | 5,109 | 6,480 | 4,789 | 4,226 |
| 2012 | 3,243 | 2,998 | 6,055 | 4,987 | 3,357 | 2,781 | 4,332 | 5,339 | 4,059 | 4,877 | 7,617 | 4,273 |
| 2013 | 2,732 | 6,813 | 3,365 | 2,735 | 2,706 | 6,147 | 8,711 | 5,982 | 5,210 | 6,128 | 4,660 | 7,026 |
| 2014 | 6,859 | 5,848 | 8,145 | 4,943 | 6,511 | 4,791 | 6,687 | 7,210 | 6,554 | 7,874 | 7,004 | 5,318 |
| 2015 | 6,543 | 7,425 | 3,207 | 7,853 | 6,292 | 5,129 | 3,815 | 6,578 | 4,583 | 3,011 | 4,776 | 7,820 |
| 2016 | 7,430 | 5,489 | 4,808 | 6,823 | 7,374 | 7,226 | 9,585 | 8,716 | 6,045 | 8,244 | 11,152 | 9,775 |
| 2017 | 8,196 | 8,735 | 9,244 | 11,906 | 11,238 | 11,408 | 12,283 | 12,294 | 12,699 | 15,242 | 13,320 | 11,701 |
| 2018 | 11,054 | 9,535 | 12,045 | 10,547 | 9,538 | 12,913 | 10,953 | 10,984 | 11,391 | 16,919 | 11,910 | 14,627 |
| 2019 | 14,177 | 9,183 | 17,031 | 12,611 | 12,832 | 16,534 | 14,432 | 13,371 | 17,535 | 13,697 | 14,261 | 15,161 |
| 2020 | 15,693 | 13,693 | 14,740 | 10,441 | 7,908 | 8,597 | 13,776 | 14,836 | 13,289 | 15,141 | 10,590 | 14,964 |
| 2021 | 13,433 | 11,664 | 8,076 | 9,382 | 10,579 | 13,290 | 16,347 | 16,271 | 11,153 | 13,605 | 11,583 | 13,351 |
| 2022 | 9,329 | 7,485 | 15,525 | 14,953 | 12,106 | 13,660 | 16,052 | 10,872 | 13,477 | 6,480 | 9,821 | 10,687 |
| 2023 | 6,357 | 6,103 | 8,158 | 5,935 | 9,233 | 9,033 | 6,453 | 8,134 | 6,441 | 6,205 | 6,136 | 7,103 |
| 2024 | 10,284 | |||||||||||
| - = No Data Reported; -- = Not Applicable; NA = Not Available; W = Withheld to avoid disclosure of individual company data. |
| Release Date: 3/29/2024 |
| Next Release Date: 4/30/2024 |