|
Download Data (XLS File) |
|
||||||||
|
||||||||
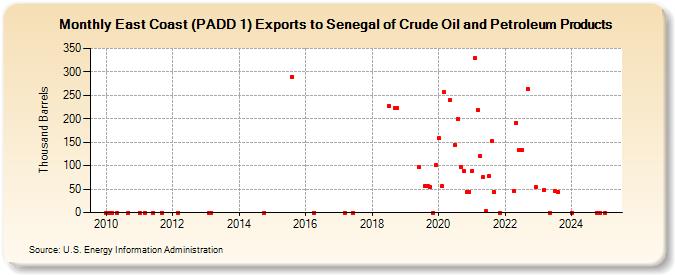
| East Coast (PADD 1) Exports to Senegal of Crude Oil and Petroleum Products (Thousand Barrels) | ||||||||
| Year | Jan | Feb | Mar | Apr | May | Jun | Jul | Aug | Sep | Oct | Nov | Dec |
|---|---|---|---|---|---|---|---|---|---|---|---|---|
| 2010 | 0 | 0 | 0 | 0 | 0 | |||||||
| 2011 | 0 | 0 | 0 | 0 | ||||||||
| 2012 | 0 | |||||||||||
| 2013 | 0 | 0 | ||||||||||
| 2014 | 0 | |||||||||||
| 2015 | 290 | |||||||||||
| 2016 | 0 | |||||||||||
| 2017 | 0 | 0 | ||||||||||
| 2018 | 227 | 223 | 222 | |||||||||
| 2019 | 97 | 57 | 57 | 55 | 0 | 101 | ||||||
| 2020 | 158 | 56 | 256 | 240 | 144 | 200 | 98 | 89 | 44 | 44 | ||
| 2021 | 89 | 329 | 219 | 120 | 75 | 3 | 77 | 152 | 44 | 0 | ||
| 2022 | 45 | 192 | 134 | 133 | 264 | 55 | ||||||
| 2023 | 48 | 0 | 45 | 44 | ||||||||
| 2024 | 0 | |||||||||||
| - = No Data Reported; -- = Not Applicable; NA = Not Available; W = Withheld to avoid disclosure of individual company data. |
| Release Date: 3/29/2024 |
| Next Release Date: 4/30/2024 |