|
Download Data (XLS File) |
|
||||||||
|
||||||||
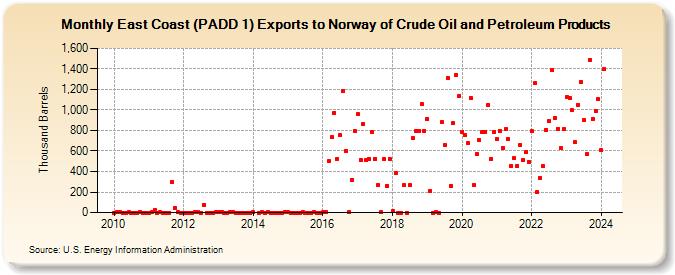
| East Coast (PADD 1) Exports to Norway of Crude Oil and Petroleum Products (Thousand Barrels) | ||||||||
| Year | Jan | Feb | Mar | Apr | May | Jun | Jul | Aug | Sep | Oct | Nov | Dec |
|---|---|---|---|---|---|---|---|---|---|---|---|---|
| 2010 | 0 | 1 | 1 | 0 | 0 | 4 | 0 | 0 | 0 | 1 | 0 | 0 |
| 2011 | 0 | 1 | 25 | 0 | 1 | 0 | 0 | 0 | 301 | 49 | 3 | 0 |
| 2012 | 0 | 0 | 0 | 0 | 7 | 1 | 0 | 78 | 0 | 0 | 0 | 1 |
| 2013 | 1 | 1 | 0 | 0 | 3 | 2 | 0 | 0 | 0 | 0 | 0 | 0 |
| 2014 | 1 | 0 | 1 | 0 | 1 | 0 | 0 | 0 | 0 | 0 | 1 | |
| 2015 | 1 | 0 | 0 | 0 | 0 | 1 | 0 | 0 | 0 | 1 | 0 | 0 |
| 2016 | 1 | 1 | 498 | 736 | 975 | 523 | 752 | 1,189 | 603 | 4 | 322 | 793 |
| 2017 | 957 | 517 | 867 | 511 | 526 | 787 | 526 | 265 | 1 | 525 | 263 | 525 |
| 2018 | 14 | 381 | 0 | 0 | 266 | 0 | 265 | 722 | 793 | 793 | 1,058 | 793 |
| 2019 | 910 | 208 | 0 | 1 | 0 | 883 | 658 | 1,312 | 262 | 872 | 1,345 | 1,139 |
| 2020 | 788 | 752 | 675 | 1,116 | 270 | 572 | 705 | 787 | 788 | 1,050 | 525 | 783 |
| 2021 | 715 | 796 | 627 | 812 | 717 | 454 | 529 | 454 | 662 | 512 | 587 | 497 |
| 2022 | 792 | 1,264 | 199 | 339 | 452 | 809 | 894 | 1,386 | 923 | 819 | 631 | 815 |
| 2023 | 1,126 | 1,121 | 996 | 686 | 1,052 | 1,272 | 899 | 566 | 1,491 | 910 | 991 | 1,106 |
| 2024 | 608 | 1,397 | 1,154 | 1,244 | ||||||||
| - = No Data Reported; -- = Not Applicable; NA = Not Available; W = Withheld to avoid disclosure of individual company data. |
| Release Date: 6/28/2024 |
| Next Release Date: 7/31/2024 |