|
Download Data (XLS File) |
|
||||||||
|
||||||||
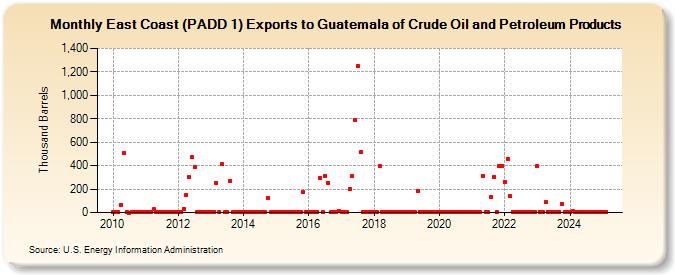
| East Coast (PADD 1) Exports to Guatemala of Crude Oil and Petroleum Products (Thousand Barrels) | ||||||||
| Year | Jan | Feb | Mar | Apr | May | Jun | Jul | Aug | Sep | Oct | Nov | Dec |
|---|---|---|---|---|---|---|---|---|---|---|---|---|
| 2010 | 1 | 1 | 1 | 61 | 510 | 2 | 0 | 1 | 2 | 3 | 1 | 1 |
| 2011 | 1 | 2 | 4 | 28 | 3 | 2 | 1 | 3 | 1 | 1 | 1 | 1 |
| 2012 | 1 | 1 | 32 | 153 | 301 | 471 | 391 | 1 | 1 | 1 | 1 | 1 |
| 2013 | 1 | 1 | 248 | 2 | 410 | 2 | 1 | 269 | 3 | 2 | 3 | 2 |
| 2014 | 1 | 4 | 3 | 3 | 1 | 1 | 3 | 1 | 2 | 124 | 1 | 3 |
| 2015 | 2 | 1 | 2 | 4 | 3 | 2 | 2 | 3 | 2 | 2 | 174 | 3 |
| 2016 | 2 | 2 | 2 | 4 | 295 | 3 | 312 | 255 | 2 | 3 | 2 | 13 |
| 2017 | 2 | 5 | 3 | 202 | 308 | 792 | 1,249 | 513 | 3 | 3 | 3 | 3 |
| 2018 | 3 | 4 | 396 | 5 | 3 | 3 | 3 | 2 | 4 | 3 | 4 | 2 |
| 2019 | 4 | 4 | 4 | 3 | 185 | 4 | 3 | 3 | 3 | 3 | 4 | 3 |
| 2020 | 3 | 3 | 4 | 3 | 2 | 1 | 3 | 4 | 2 | 6 | 4 | 4 |
| 2021 | 4 | 3 | 4 | 3 | 313 | 6 | 2 | 134 | 306 | 2 | 400 | 401 |
| 2022 | 263 | 458 | 139 | 6 | 4 | 6 | 4 | 5 | 4 | 2 | 2 | 2 |
| 2023 | 393 | 3 | 4 | 90 | 4 | 3 | 3 | 3 | 3 | 74 | 3 | 3 |
| 2024 | 2 | |||||||||||
| - = No Data Reported; -- = Not Applicable; NA = Not Available; W = Withheld to avoid disclosure of individual company data. |
| Release Date: 3/29/2024 |
| Next Release Date: 4/30/2024 |