|
Download Data (XLS File) |
|
||||||||
|
||||||||
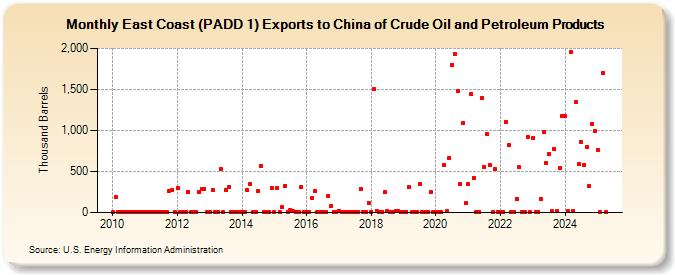
| East Coast (PADD 1) Exports to China of Crude Oil and Petroleum Products (Thousand Barrels) | ||||||||
| Year | Jan | Feb | Mar | Apr | May | Jun | Jul | Aug | Sep | Oct | Nov | Dec |
|---|---|---|---|---|---|---|---|---|---|---|---|---|
| 2010 | 5 | 190 | 4 | 3 | 6 | 4 | 4 | 5 | 6 | 11 | 6 | 4 |
| 2011 | 3 | 6 | 4 | 7 | 11 | 5 | 5 | 10 | 10 | 265 | 273 | 4 |
| 2012 | 300 | 5 | 4 | 7 | 251 | 5 | 4 | 4 | 250 | 290 | 293 | 5 |
| 2013 | 3 | 280 | 8 | 7 | 532 | 5 | 278 | 308 | 5 | 5 | 6 | 5 |
| 2014 | 7 | 6 | 274 | 348 | 7 | 7 | 262 | 565 | 7 | 10 | 8 | 304 |
| 2015 | 7 | 299 | 12 | 64 | 327 | 11 | 37 | 13 | 11 | 9 | 316 | 6 |
| 2016 | 7 | 4 | 182 | 258 | 7 | 9 | 5 | 9 | 202 | 81 | 6 | 8 |
| 2017 | 16 | 11 | 10 | 8 | 10 | 12 | 12 | 7 | 287 | 9 | 7 | 120 |
| 2018 | 11 | 1,501 | 23 | 6 | 11 | 247 | 13 | 12 | 7 | 13 | 15 | 12 |
| 2019 | 5 | 10 | 310 | 8 | 6 | 7 | 350 | 9 | 7 | 8 | 248 | 6 |
| 2020 | 12 | 8 | 6 | 577 | 15 | 666 | 1,801 | 1,933 | 1,480 | 349 | 1,091 | 115 |
| 2021 | 344 | 1,442 | 427 | 7 | 8 | 1,399 | 554 | 963 | 579 | 6 | 528 | 8 |
| 2022 | 4 | 10 | 1,108 | 825 | 7 | 8 | 163 | 549 | 9 | 7 | 926 | 7 |
| 2023 | 913 | 5 | 8 | 295 | 981 | 599 | 715 | 13 | 772 | 14 | 551 | 1,173 |
| 2024 | 1,174 | |||||||||||
| - = No Data Reported; -- = Not Applicable; NA = Not Available; W = Withheld to avoid disclosure of individual company data. |
| Release Date: 3/29/2024 |
| Next Release Date: 4/30/2024 |