|
Download Data (XLS File) |
|
||||||||
|
||||||||
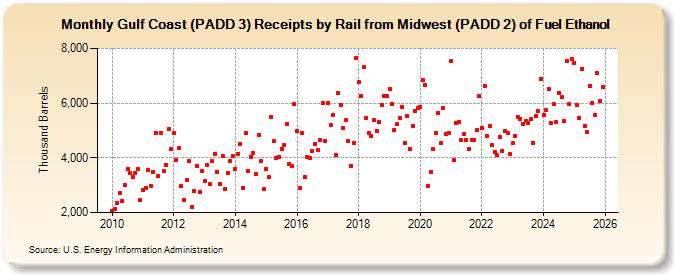
| Gulf Coast (PADD 3) Receipts by Rail from Midwest (PADD 2) of Fuel Ethanol (Thousand Barrels) | ||||||||
| Year | Jan | Feb | Mar | Apr | May | Jun | Jul | Aug | Sep | Oct | Nov | Dec |
|---|---|---|---|---|---|---|---|---|---|---|---|---|
| 2010 | 2,042 | 2,128 | 2,361 | 2,705 | 2,433 | 3,024 | 3,591 | 3,428 | 3,313 | 3,452 | 3,574 | 2,452 |
| 2011 | 2,835 | 2,909 | 3,554 | 2,983 | 3,472 | 4,921 | 3,337 | 4,925 | 3,514 | 3,741 | 5,071 | 4,331 |
| 2012 | 4,909 | 3,917 | 4,347 | 2,959 | 2,457 | 3,206 | 3,869 | 2,200 | 2,770 | 3,685 | 2,763 | 3,508 |
| 2013 | 3,167 | 3,721 | 3,047 | 3,871 | 4,138 | 3,466 | 3,048 | 4,053 | 2,847 | 3,446 | 3,896 | 4,073 |
| 2014 | 3,605 | 4,142 | 4,507 | 2,891 | 4,907 | 3,509 | 4,028 | 4,178 | 3,394 | 4,842 | 3,883 | 2,872 |
| 2015 | 3,606 | 3,296 | 5,496 | 4,602 | 3,981 | 4,045 | 4,329 | 4,460 | 5,247 | 3,777 | 3,714 | 5,982 |
| 2016 | 4,970 | 2,886 | 4,901 | 3,306 | 4,023 | 3,985 | 4,252 | 4,493 | 4,293 | 4,663 | 5,988 | 4,609 |
| 2017 | 6,020 | 5,211 | 5,575 | 4,102 | 6,352 | 5,923 | 5,084 | 5,373 | 4,600 | 3,715 | 4,534 | 7,661 |
| 2018 | 6,766 | 6,254 | 7,306 | 5,444 | 4,896 | 4,786 | 5,370 | 4,990 | 5,315 | 5,947 | 6,262 | 6,252 |
| 2019 | 6,515 | 5,981 | 5,018 | 5,225 | 5,459 | 5,857 | 4,555 | 5,515 | 4,335 | 5,162 | 5,697 | 5,838 |
| 2020 | 5,858 | 6,829 | 6,659 | 2,970 | 3,469 | 4,320 | 4,914 | 5,652 | 4,539 | 5,808 | 4,861 | 4,913 |
| 2021 | 7,542 | 3,907 | 5,284 | 5,310 | 4,655 | 4,863 | 4,653 | 4,322 | 4,646 | 4,652 | 5,020 | 6,261 |
| 2022 | 5,106 | 6,624 | 4,786 | 5,160 | 4,476 | 4,223 | 4,086 | 4,766 | 4,256 | 4,965 | 4,906 | 4,134 |
| 2023 | 4,530 | 4,789 | 5,476 | 5,436 | 5,238 | 5,351 | 5,266 | 5,415 | 4,558 | 5,515 | 5,698 | 6,868 |
| 2024 | 5,303 | |||||||||||
| - = No Data Reported; -- = Not Applicable; NA = Not Available; W = Withheld to avoid disclosure of individual company data. |
| Release Date: 3/29/2024 |
| Next Release Date: 4/30/2024 |