|
Download Data (XLS File) |
|
||||||||
|
||||||||
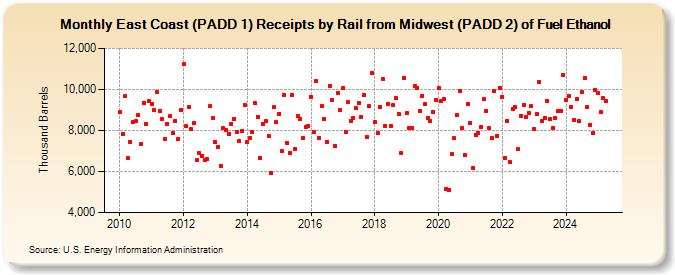
| East Coast (PADD 1) Receipts by Rail from Midwest (PADD 2) of Fuel Ethanol (Thousand Barrels) | ||||||||
| Year | Jan | Feb | Mar | Apr | May | Jun | Jul | Aug | Sep | Oct | Nov | Dec |
|---|---|---|---|---|---|---|---|---|---|---|---|---|
| 2010 | 8,877 | 7,848 | 9,669 | 6,647 | 7,455 | 8,415 | 8,442 | 8,738 | 7,335 | 9,362 | 8,301 | 9,422 |
| 2011 | 9,298 | 8,990 | 9,860 | 8,938 | 8,549 | 7,604 | 8,322 | 8,691 | 7,859 | 8,484 | 7,588 | 8,992 |
| 2012 | 11,215 | 8,196 | 9,151 | 8,063 | 8,382 | 6,552 | 6,889 | 6,775 | 6,566 | 6,606 | 9,175 | 8,585 |
| 2013 | 7,442 | 7,182 | 6,267 | 8,108 | 8,011 | 7,822 | 8,316 | 8,583 | 7,927 | 7,469 | 7,975 | 9,253 |
| 2014 | 7,418 | 7,634 | 7,902 | 9,316 | 8,665 | 6,651 | 8,326 | 8,448 | 7,746 | 5,911 | 9,120 | 8,395 |
| 2015 | 8,819 | 7,000 | 9,713 | 7,408 | 6,923 | 9,707 | 7,112 | 8,706 | 8,571 | 7,623 | 8,149 | 8,237 |
| 2016 | 9,635 | 7,927 | 10,391 | 7,640 | 9,183 | 8,535 | 7,454 | 10,179 | 9,465 | 7,261 | 9,823 | 8,982 |
| 2017 | 10,066 | 7,935 | 9,375 | 8,468 | 8,608 | 9,080 | 9,343 | 8,668 | 9,713 | 7,698 | 9,179 | 10,793 |
| 2018 | 8,406 | 7,878 | 9,168 | 10,491 | 8,211 | 9,297 | 8,197 | 9,237 | 9,564 | 8,818 | 6,911 | 10,559 |
| 2019 | 8,860 | 8,102 | 8,134 | 10,149 | 10,080 | 8,950 | 9,695 | 9,302 | 8,613 | 8,466 | 8,901 | 9,503 |
| 2020 | 10,066 | 9,430 | 9,531 | 5,168 | 5,090 | 6,874 | 7,610 | 8,763 | 9,928 | 8,123 | 6,793 | 9,282 |
| 2021 | 8,374 | 6,174 | 7,793 | 7,886 | 8,175 | 9,514 | 8,973 | 8,100 | 7,635 | 9,914 | 7,751 | 10,084 |
| 2022 | 9,651 | 6,666 | 8,474 | 6,445 | 9,057 | 9,139 | 7,084 | 8,713 | 9,264 | 8,666 | 8,853 | 9,183 |
| 2023 | 8,053 | 8,827 | 10,379 | 8,441 | 8,584 | 9,441 | 8,542 | 8,124 | 8,616 | 8,923 | 8,942 | 10,424 |
| 2024 | 9,760 | |||||||||||
| - = No Data Reported; -- = Not Applicable; NA = Not Available; W = Withheld to avoid disclosure of individual company data. |
| Release Date: 3/29/2024 |
| Next Release Date: 4/30/2024 |