|
Download Data (XLS File) |
|
||||||||
|
||||||||
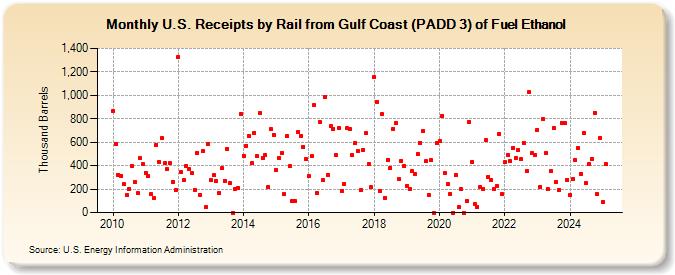
| U.S. Receipts by Rail from Gulf Coast (PADD 3) of Fuel Ethanol (Thousand Barrels) | ||||||||
| Year | Jan | Feb | Mar | Apr | May | Jun | Jul | Aug | Sep | Oct | Nov | Dec |
|---|---|---|---|---|---|---|---|---|---|---|---|---|
| 2010 | 864 | 584 | 321 | 314 | 242 | 149 | 201 | 400 | 261 | 164 | 462 | 411 |
| 2011 | 341 | 309 | 156 | 126 | 579 | 432 | 635 | 420 | 371 | 419 | 262 | 191 |
| 2012 | 1,327 | 344 | 276 | 396 | 372 | 334 | 195 | 510 | 152 | 522 | 46 | 584 |
| 2013 | 277 | 317 | 269 | 163 | 376 | 272 | 545 | 249 | 0 | 199 | 212 | 841 |
| 2014 | 486 | 570 | 657 | 419 | 680 | 479 | 850 | 467 | 489 | 217 | 712 | 664 |
| 2015 | 367 | 465 | 509 | 155 | 652 | 393 | 97 | 97 | 687 | 656 | 557 | 454 |
| 2016 | 309 | 481 | 913 | 163 | 773 | 275 | 989 | 321 | 735 | 714 | 488 | 718 |
| 2017 | 184 | 247 | 719 | 710 | 488 | 595 | 523 | 189 | 537 | 675 | 413 | 214 |
| 2018 | 1,156 | 947 | 187 | 837 | 128 | 451 | 380 | 715 | 765 | 288 | 442 | 395 |
| 2019 | 228 | 204 | 351 | 330 | 500 | 596 | 692 | 436 | 154 | 444 | 0 | 593 |
| 2020 | 609 | 827 | 335 | 241 | 162 | 0 | 318 | 44 | 197 | 0 | 96 | 773 |
| 2021 | 434 | 69 | 48 | 215 | 202 | 616 | 307 | 279 | 199 | 228 | 672 | 159 |
| 2022 | 427 | 495 | 437 | 554 | 466 | 534 | 454 | 590 | 354 | 1,028 | 508 | 494 |
| 2023 | 706 | 222 | 796 | 507 | 198 | 352 | 723 | 262 | 196 | 767 | 760 | 281 |
| 2024 | 150 | |||||||||||
| - = No Data Reported; -- = Not Applicable; NA = Not Available; W = Withheld to avoid disclosure of individual company data. |
| Release Date: 3/29/2024 |
| Next Release Date: 4/30/2024 |
Referring Pages: