|
Download Data (XLS File) |
|
||||||||
|
||||||||
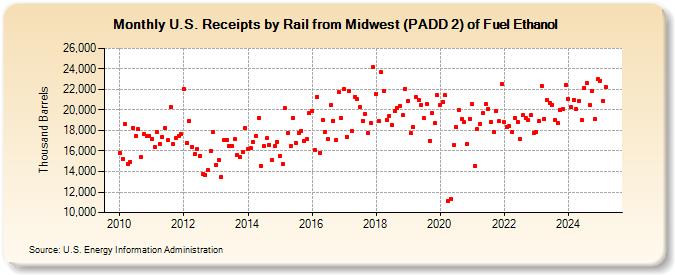
| U.S. Receipts by Rail from Midwest (PADD 2) of Fuel Ethanol (Thousand Barrels) | ||||||||
| Year | Jan | Feb | Mar | Apr | May | Jun | Jul | Aug | Sep | Oct | Nov | Dec |
|---|---|---|---|---|---|---|---|---|---|---|---|---|
| 2010 | 15,824 | 15,207 | 18,589 | 14,734 | 14,940 | 18,252 | 17,459 | 18,112 | 15,393 | 17,618 | 17,434 | 17,508 |
| 2011 | 17,217 | 16,408 | 17,848 | 16,667 | 17,341 | 18,245 | 17,045 | 20,266 | 16,671 | 17,224 | 17,439 | 17,610 |
| 2012 | 22,009 | 16,769 | 18,894 | 16,392 | 15,664 | 16,170 | 15,550 | 13,772 | 13,700 | 14,149 | 15,984 | 17,809 |
| 2013 | 14,679 | 15,092 | 13,447 | 17,045 | 17,105 | 16,449 | 16,525 | 17,121 | 15,624 | 15,398 | 15,876 | 18,248 |
| 2014 | 16,176 | 16,262 | 16,887 | 17,486 | 19,235 | 14,522 | 16,444 | 17,219 | 16,614 | 15,121 | 16,484 | 16,903 |
| 2015 | 15,491 | 14,716 | 20,155 | 17,776 | 16,469 | 19,240 | 16,794 | 17,790 | 17,932 | 17,007 | 17,164 | 19,676 |
| 2016 | 19,942 | 16,127 | 21,267 | 15,837 | 19,066 | 17,883 | 17,128 | 20,447 | 18,959 | 17,107 | 21,719 | 19,250 |
| 2017 | 22,010 | 17,386 | 21,812 | 17,939 | 21,276 | 21,035 | 20,265 | 18,955 | 19,592 | 17,717 | 18,737 | 24,162 |
| 2018 | 21,582 | 18,903 | 23,658 | 21,872 | 19,064 | 19,435 | 18,514 | 19,920 | 20,203 | 20,362 | 19,469 | 22,031 |
| 2019 | 20,875 | 17,711 | 18,318 | 21,245 | 20,994 | 20,459 | 19,182 | 20,622 | 17,009 | 19,679 | 18,706 | 21,423 |
| 2020 | 20,462 | 20,820 | 21,417 | 11,146 | 11,323 | 16,579 | 18,303 | 20,004 | 19,140 | 18,794 | 16,695 | 19,167 |
| 2021 | 20,540 | 14,525 | 18,138 | 18,662 | 19,673 | 20,538 | 20,129 | 18,821 | 17,868 | 19,901 | 18,876 | 22,509 |
| 2022 | 18,797 | 18,350 | 18,429 | 17,811 | 19,236 | 18,863 | 17,122 | 19,468 | 19,189 | 18,976 | 19,503 | 17,795 |
| 2023 | 17,843 | 18,937 | 22,375 | 19,150 | 20,975 | 20,714 | 20,527 | 19,052 | 18,740 | 20,019 | 20,064 | 22,417 |
| 2024 | 21,076 | 20,033 | 20,825 | 19,512 | ||||||||
| - = No Data Reported; -- = Not Applicable; NA = Not Available; W = Withheld to avoid disclosure of individual company data. |
| Release Date: 6/28/2024 |
| Next Release Date: 7/31/2024 |
Referring Pages: