|
Download Data (XLS File) |
|
||||||||
|
||||||||
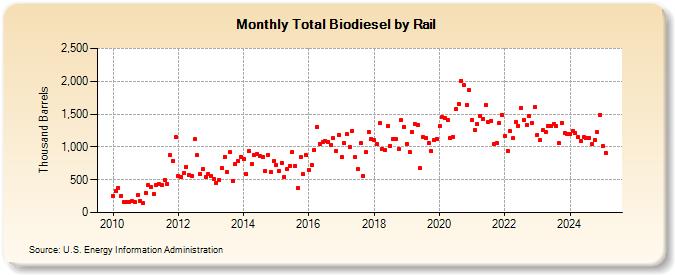
| Total Biodiesel by Rail (Thousand Barrels) | ||||||||
| Year | Jan | Feb | Mar | Apr | May | Jun | Jul | Aug | Sep | Oct | Nov | Dec |
|---|---|---|---|---|---|---|---|---|---|---|---|---|
| 2010 | 255 | 322 | 380 | 253 | 158 | 165 | 163 | 175 | 154 | 261 | 180 | 140 |
| 2011 | 300 | 417 | 392 | 288 | 417 | 438 | 422 | 492 | 438 | 871 | 792 | 1,147 |
| 2012 | 558 | 548 | 600 | 698 | 572 | 560 | 1,116 | 869 | 584 | 656 | 544 | 587 |
| 2013 | 558 | 517 | 446 | 497 | 685 | 852 | 615 | 921 | 482 | 736 | 788 | 853 |
| 2014 | 809 | 585 | 936 | 734 | 881 | 892 | 862 | 852 | 633 | 881 | 624 | 783 |
| 2015 | 725 | 636 | 760 | 545 | 659 | 706 | 919 | 715 | 371 | 841 | 582 | 873 |
| 2016 | 649 | 731 | 959 | 1,306 | 1,049 | 1,076 | 1,093 | 1,073 | 1,031 | 1,135 | 942 | 1,183 |
| 2017 | 839 | 1,052 | 1,189 | 999 | 1,247 | 842 | 657 | 1,059 | 558 | 915 | 1,227 | 1,122 |
| 2018 | 1,101 | 1,042 | 1,361 | 969 | 950 | 1,321 | 1,015 | 1,119 | 1,115 | 967 | 1,402 | 1,308 |
| 2019 | 1,050 | 920 | 1,224 | 1,351 | 1,338 | 671 | 1,152 | 1,137 | 1,060 | 931 | 1,099 | 1,126 |
| 2020 | 1,318 | 1,452 | 1,439 | 1,410 | 1,131 | 1,157 | 1,576 | 1,646 | 2,010 | 1,935 | 1,644 | 1,860 |
| 2021 | 1,416 | 1,260 | 1,345 | 1,470 | 1,408 | 1,629 | 1,375 | 1,398 | 1,040 | 1,053 | 1,364 | 1,492 |
| 2022 | 1,167 | 944 | 1,238 | 1,130 | 1,374 | 1,325 | 1,595 | 1,412 | 1,331 | 1,476 | 1,364 | 1,605 |
| 2023 | 1,183 | 1,100 | 1,250 | 1,228 | 1,320 | 1,313 | 1,349 | 1,317 | 1,054 | 1,369 | 1,203 | 1,174 |
| 2024 | 1,188 | |||||||||||
| - = No Data Reported; -- = Not Applicable; NA = Not Available; W = Withheld to avoid disclosure of individual company data. |
| Release Date: 3/29/2024 |
| Next Release Date: 4/30/2024 |
Referring Pages: