|
Download Data (XLS File) |
|
||||||||
|
||||||||
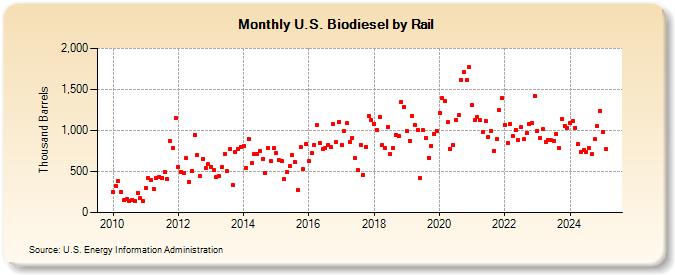
| U.S. Biodiesel by Rail (Thousand Barrels) | ||||||||
| Year | Jan | Feb | Mar | Apr | May | Jun | Jul | Aug | Sep | Oct | Nov | Dec |
|---|---|---|---|---|---|---|---|---|---|---|---|---|
| 2010 | 255 | 322 | 380 | 253 | 147 | 160 | 135 | 156 | 137 | 243 | 173 | 140 |
| 2011 | 300 | 417 | 392 | 288 | 417 | 438 | 422 | 492 | 403 | 870 | 792 | 1,147 |
| 2012 | 558 | 499 | 477 | 661 | 378 | 507 | 949 | 707 | 443 | 650 | 544 | 587 |
| 2013 | 558 | 517 | 428 | 446 | 551 | 718 | 502 | 772 | 332 | 736 | 770 | 798 |
| 2014 | 805 | 545 | 901 | 598 | 711 | 713 | 746 | 648 | 476 | 790 | 624 | 783 |
| 2015 | 725 | 636 | 627 | 410 | 493 | 562 | 699 | 620 | 279 | 794 | 527 | 836 |
| 2016 | 625 | 723 | 826 | 1,062 | 849 | 774 | 789 | 821 | 803 | 1,075 | 860 | 1,109 |
| 2017 | 828 | 989 | 1,086 | 861 | 912 | 661 | 519 | 828 | 463 | 802 | 1,174 | 1,122 |
| 2018 | 1,083 | 1,003 | 1,162 | 825 | 782 | 1,037 | 715 | 789 | 948 | 929 | 1,347 | 1,288 |
| 2019 | 989 | 876 | 1,171 | 1,067 | 1,010 | 425 | 1,000 | 913 | 670 | 811 | 962 | 997 |
| 2020 | 1,213 | 1,398 | 1,365 | 1,099 | 773 | 818 | 1,130 | 1,188 | 1,620 | 1,712 | 1,614 | 1,774 |
| 2021 | 1,311 | 1,123 | 1,162 | 1,124 | 986 | 1,117 | 923 | 994 | 750 | 895 | 1,244 | 1,398 |
| 2022 | 1,065 | 843 | 1,080 | 933 | 1,008 | 890 | 1,039 | 893 | 972 | 1,084 | 1,097 | 1,420 |
| 2023 | 994 | 910 | 1,015 | 861 | 878 | 884 | 871 | 963 | 785 | 1,140 | 1,051 | 1,011 |
| 2024 | 1,083 | |||||||||||
| - = No Data Reported; -- = Not Applicable; NA = Not Available; W = Withheld to avoid disclosure of individual company data. |
| Release Date: 3/29/2024 |
| Next Release Date: 4/30/2024 |
Referring Pages: