|
Download Data (XLS File) |
|
||||||||
|
||||||||
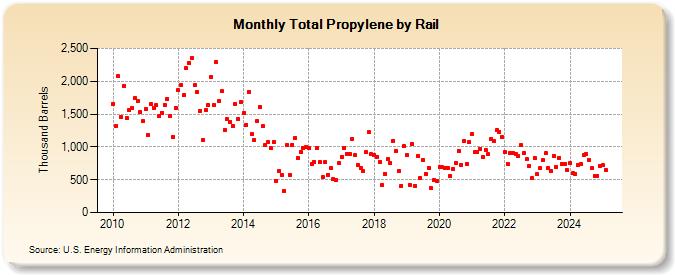
| Total Propylene by Rail (Thousand Barrels) | ||||||||
| Year | Jan | Feb | Mar | Apr | May | Jun | Jul | Aug | Sep | Oct | Nov | Dec |
|---|---|---|---|---|---|---|---|---|---|---|---|---|
| 2010 | 1,657 | 1,315 | 2,073 | 1,458 | 1,932 | 1,437 | 1,558 | 1,598 | 1,738 | 1,699 | 1,530 | 1,388 |
| 2011 | 1,573 | 1,182 | 1,652 | 1,594 | 1,633 | 1,466 | 1,520 | 1,642 | 1,727 | 1,478 | 1,158 | 1,597 |
| 2012 | 1,860 | 1,947 | 1,785 | 2,196 | 2,281 | 2,354 | 1,937 | 1,834 | 1,549 | 1,112 | 1,556 | 1,634 |
| 2013 | 2,066 | 1,639 | 2,290 | 1,692 | 1,844 | 1,260 | 1,419 | 1,382 | 1,319 | 1,652 | 1,427 | 1,683 |
| 2014 | 1,518 | 1,335 | 1,841 | 1,189 | 1,104 | 1,389 | 1,609 | 1,314 | 1,034 | 1,075 | 979 | 1,073 |
| 2015 | 486 | 627 | 576 | 327 | 1,028 | 574 | 1,033 | 1,139 | 834 | 925 | 981 | 999 |
| 2016 | 978 | 743 | 775 | 984 | 765 | 540 | 766 | 577 | 679 | 505 | 494 | 756 |
| 2017 | 852 | 990 | 897 | 887 | 1,121 | 875 | 724 | 671 | 628 | 921 | 1,224 | 889 |
| 2018 | 881 | 847 | 774 | 423 | 591 | 811 | 751 | 1,095 | 939 | 627 | 410 | 1,010 |
| 2019 | 869 | 427 | 1,046 | 410 | 859 | 523 | 800 | 589 | 685 | 368 | 489 | 483 |
| 2020 | 697 | 687 | 672 | 684 | 557 | 667 | 761 | 938 | 727 | 1,094 | 744 | 1,067 |
| 2021 | 1,197 | 922 | 925 | 972 | 847 | 953 | 886 | 1,127 | 1,085 | 1,252 | 1,234 | 1,154 |
| 2022 | 918 | 747 | 906 | 904 | 897 | 865 | 1,028 | 905 | 811 | 714 | 520 | 837 |
| 2023 | 582 | 674 | 798 | 903 | 675 | 636 | 865 | 690 | 832 | 743 | 746 | 627 |
| 2024 | 645 | |||||||||||
| - = No Data Reported; -- = Not Applicable; NA = Not Available; W = Withheld to avoid disclosure of individual company data. |
| Release Date: 3/29/2024 |
| Next Release Date: 4/30/2024 |
Referring Pages: