|
Download Data (XLS File) |
|
||||||||
|
||||||||
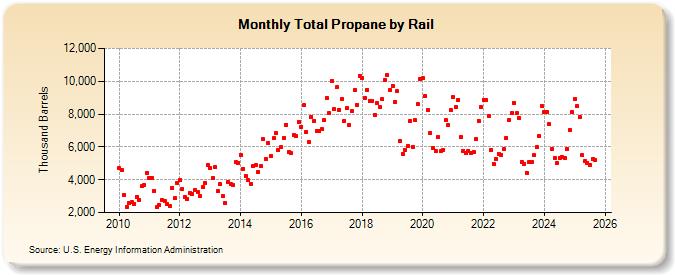
| Total Propane by Rail (Thousand Barrels) | ||||||||
| Year | Jan | Feb | Mar | Apr | May | Jun | Jul | Aug | Sep | Oct | Nov | Dec |
|---|---|---|---|---|---|---|---|---|---|---|---|---|
| 2010 | 4,700 | 4,575 | 3,092 | 2,359 | 2,579 | 2,633 | 2,550 | 2,977 | 2,774 | 3,594 | 3,692 | 4,440 |
| 2011 | 4,109 | 4,116 | 3,343 | 2,333 | 2,453 | 2,795 | 2,706 | 2,548 | 2,398 | 3,520 | 2,861 | 3,801 |
| 2012 | 3,982 | 3,442 | 2,945 | 2,817 | 3,204 | 3,142 | 3,404 | 3,255 | 2,980 | 3,556 | 3,814 | 4,896 |
| 2013 | 4,709 | 4,109 | 4,785 | 3,284 | 3,724 | 2,989 | 2,558 | 3,856 | 3,722 | 3,695 | 5,072 | 5,025 |
| 2014 | 5,508 | 4,679 | 4,253 | 3,978 | 3,769 | 4,819 | 4,893 | 4,471 | 4,816 | 6,459 | 5,268 | 6,249 |
| 2015 | 5,434 | 6,520 | 6,830 | 5,790 | 5,978 | 6,537 | 7,349 | 5,702 | 5,615 | 6,739 | 6,663 | 7,531 |
| 2016 | 7,230 | 8,533 | 6,926 | 6,281 | 7,846 | 7,597 | 6,980 | 6,942 | 7,073 | 7,619 | 8,984 | 8,039 |
| 2017 | 10,043 | 8,299 | 9,625 | 8,271 | 8,941 | 7,582 | 8,342 | 7,357 | 8,170 | 9,461 | 8,580 | 10,338 |
| 2018 | 10,210 | 8,997 | 9,470 | 8,772 | 8,807 | 7,972 | 8,662 | 8,450 | 8,901 | 10,104 | 10,352 | 9,462 |
| 2019 | 9,731 | 8,746 | 9,379 | 6,374 | 5,588 | 5,840 | 6,044 | 7,588 | 6,015 | 7,619 | 8,583 | 10,125 |
| 2020 | 10,169 | 9,093 | 8,264 | 6,831 | 5,948 | 5,740 | 6,607 | 5,727 | 5,835 | 7,630 | 7,350 | 8,258 |
| 2021 | 9,018 | 8,405 | 8,881 | 6,587 | 5,753 | 5,621 | 5,762 | 5,638 | 5,699 | 6,466 | 7,600 | 8,443 |
| 2022 | 8,884 | 8,839 | 7,897 | 5,804 | 4,986 | 5,274 | 5,592 | 5,536 | 5,844 | 6,561 | 7,647 | 8,060 |
| 2023 | 8,766 | 8,037 | 7,749 | 5,140 | 4,961 | 4,438 | 5,056 | 5,089 | 5,498 | 5,932 | 6,749 | 8,165 |
| 2024 | 8,386 | |||||||||||
| - = No Data Reported; -- = Not Applicable; NA = Not Available; W = Withheld to avoid disclosure of individual company data. |
| Release Date: 3/29/2024 |
| Next Release Date: 4/30/2024 |
Referring Pages: