|
Download Data (XLS File) |
|
||||||||
|
||||||||
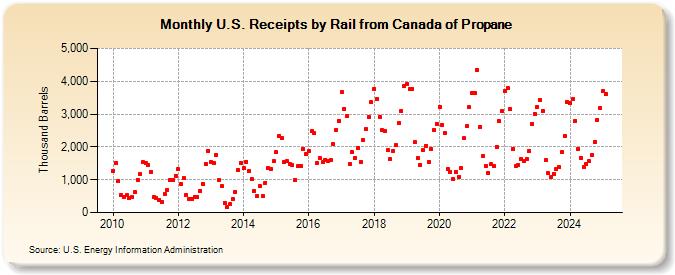
| U.S. Receipts by Rail from Canada of Propane (Thousand Barrels) | ||||||||
| Year | Jan | Feb | Mar | Apr | May | Jun | Jul | Aug | Sep | Oct | Nov | Dec |
|---|---|---|---|---|---|---|---|---|---|---|---|---|
| 2010 | 1,280 | 1,524 | 959 | 532 | 481 | 520 | 438 | 472 | 615 | 1,000 | 1,164 | 1,525 |
| 2011 | 1,498 | 1,454 | 1,239 | 470 | 440 | 396 | 334 | 571 | 698 | 989 | 988 | 1,124 |
| 2012 | 1,316 | 870 | 1,049 | 542 | 422 | 410 | 482 | 471 | 664 | 873 | 1,491 | 1,876 |
| 2013 | 1,552 | 1,524 | 1,749 | 984 | 797 | 297 | 166 | 249 | 420 | 637 | 1,310 | 1,520 |
| 2014 | 1,349 | 1,549 | 1,261 | 1,026 | 655 | 515 | 802 | 494 | 910 | 1,361 | 1,324 | 1,558 |
| 2015 | 1,835 | 2,341 | 2,262 | 1,526 | 1,561 | 1,480 | 1,441 | 995 | 1,403 | 1,419 | 1,944 | 1,796 |
| 2016 | 1,880 | 2,483 | 2,415 | 1,521 | 1,664 | 1,526 | 1,616 | 1,582 | 1,615 | 2,075 | 2,524 | 2,800 |
| 2017 | 3,664 | 3,169 | 2,931 | 1,485 | 1,836 | 1,676 | 1,968 | 1,543 | 2,204 | 2,541 | 2,913 | 3,359 |
| 2018 | 3,771 | 3,446 | 2,922 | 2,506 | 2,486 | 1,896 | 1,625 | 1,885 | 2,054 | 2,713 | 3,096 | 3,841 |
| 2019 | 3,910 | 3,757 | 3,778 | 2,141 | 1,660 | 1,457 | 1,905 | 2,040 | 1,538 | 1,936 | 2,511 | 2,705 |
| 2020 | 3,229 | 2,668 | 2,421 | 1,328 | 1,242 | 1,033 | 1,248 | 1,087 | 1,344 | 2,259 | 2,628 | 3,200 |
| 2021 | 3,639 | 3,635 | 4,347 | 2,621 | 1,710 | 1,430 | 1,220 | 1,465 | 1,424 | 2,003 | 2,776 | 3,092 |
| 2022 | 3,693 | 3,781 | 3,144 | 1,940 | 1,410 | 1,455 | 1,624 | 1,581 | 1,622 | 1,876 | 2,705 | 3,005 |
| 2023 | 3,220 | 3,435 | 3,100 | 1,598 | 1,196 | 1,082 | 1,188 | 1,341 | 1,370 | 1,844 | 2,314 | 3,339 |
| 2024 | 3,354 | |||||||||||
| - = No Data Reported; -- = Not Applicable; NA = Not Available; W = Withheld to avoid disclosure of individual company data. |
| Release Date: 3/29/2024 |
| Next Release Date: 4/30/2024 |
Referring Pages: