|
Download Data (XLS File) |
|
||||||||
|
||||||||
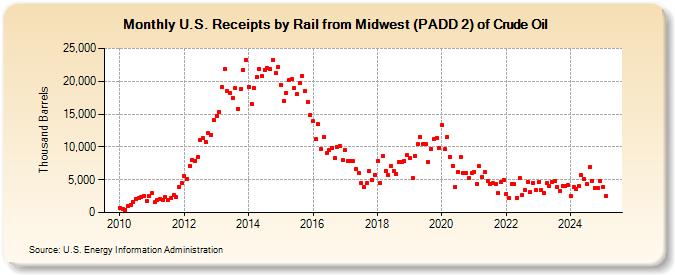
| U.S. Receipts by Rail from Midwest (PADD 2) of Crude Oil (Thousand Barrels) | ||||||||
| Year | Jan | Feb | Mar | Apr | May | Jun | Jul | Aug | Sep | Oct | Nov | Dec |
|---|---|---|---|---|---|---|---|---|---|---|---|---|
| 2010 | 695 | 550 | 431 | 961 | 1,207 | 1,585 | 2,001 | 2,190 | 2,373 | 2,596 | 1,745 | 2,595 |
| 2011 | 2,908 | 1,603 | 1,871 | 2,070 | 1,968 | 2,318 | 1,897 | 2,143 | 2,717 | 2,358 | 3,940 | 4,469 |
| 2012 | 5,515 | 5,108 | 7,068 | 8,004 | 7,892 | 8,397 | 11,091 | 11,282 | 10,695 | 12,041 | 11,852 | 14,029 |
| 2013 | 14,754 | 15,277 | 19,059 | 21,792 | 18,535 | 18,282 | 17,470 | 18,944 | 15,832 | 18,837 | 21,763 | 23,295 |
| 2014 | 19,143 | 16,591 | 18,952 | 20,586 | 21,890 | 20,768 | 21,770 | 22,005 | 21,792 | 23,276 | 21,236 | 22,172 |
| 2015 | 19,497 | 16,951 | 18,244 | 20,112 | 20,295 | 18,931 | 18,056 | 19,707 | 20,843 | 18,512 | 16,902 | 14,913 |
| 2016 | 13,890 | 11,181 | 13,426 | 9,641 | 11,555 | 9,001 | 9,599 | 9,876 | 8,315 | 10,050 | 10,062 | 8,018 |
| 2017 | 9,528 | 7,899 | 7,898 | 7,791 | 6,646 | 6,030 | 4,458 | 3,836 | 4,460 | 6,272 | 4,927 | 5,756 |
| 2018 | 7,810 | 4,472 | 8,644 | 6,372 | 5,665 | 7,072 | 6,334 | 5,904 | 7,766 | 7,724 | 7,864 | 8,697 |
| 2019 | 8,340 | 5,221 | 8,660 | 10,371 | 11,547 | 10,389 | 10,422 | 7,674 | 9,668 | 11,172 | 11,332 | 9,756 |
| 2020 | 13,370 | 9,621 | 11,510 | 8,522 | 7,125 | 3,944 | 6,234 | 8,405 | 5,965 | 5,992 | 5,205 | 6,035 |
| 2021 | 6,241 | 4,291 | 7,021 | 5,473 | 6,213 | 4,818 | 4,282 | 4,431 | 4,394 | 2,949 | 4,654 | 4,912 |
| 2022 | 2,847 | 2,247 | 4,335 | 4,281 | 2,242 | 5,204 | 2,743 | 3,370 | 4,637 | 3,141 | 4,507 | 3,391 |
| 2023 | 4,610 | 3,411 | 2,985 | 4,482 | 3,974 | 4,673 | 4,731 | 3,955 | 3,310 | 4,045 | 4,064 | 4,164 |
| 2024 | 2,519 | |||||||||||
| - = No Data Reported; -- = Not Applicable; NA = Not Available; W = Withheld to avoid disclosure of individual company data. |
| Release Date: 3/29/2024 |
| Next Release Date: 4/30/2024 |
Referring Pages: