|
Download Data (XLS File) |
|
||||||||||
|
||||||||||
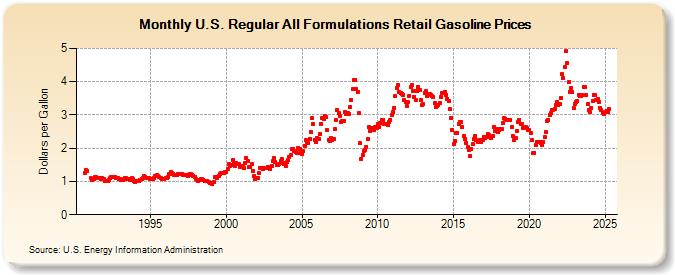
| U.S. Regular All Formulations Retail Gasoline Prices (Dollars per Gallon) | ||||||||||
| Year | Jan | Feb | Mar | Apr | May | Jun | Jul | Aug | Sep | Oct | Nov | Dec |
|---|---|---|---|---|---|---|---|---|---|---|---|---|
| 1990 | NA | 1.258 | 1.335 | 1.324 | NA | |||||||
| 1991 | NA | 1.094 | 1.040 | 1.076 | 1.126 | 1.128 | 1.096 | 1.115 | 1.109 | 1.088 | 1.099 | 1.076 |
| 1992 | 1.022 | 1.006 | 1.013 | 1.052 | 1.107 | 1.145 | 1.137 | 1.122 | 1.122 | 1.114 | 1.111 | 1.078 |
| 1993 | 1.062 | 1.054 | 1.052 | 1.078 | 1.100 | 1.097 | 1.078 | 1.062 | 1.050 | 1.092 | 1.066 | 1.014 |
| 1994 | 0.998 | 1.009 | 1.008 | 1.027 | 1.047 | 1.078 | 1.106 | 1.155 | 1.144 | 1.114 | 1.116 | 1.091 |
| 1995 | 1.082 | 1.073 | 1.072 | 1.111 | 1.178 | 1.192 | 1.154 | 1.123 | 1.111 | 1.087 | 1.062 | 1.071 |
| 1996 | 1.090 | 1.089 | 1.137 | 1.231 | 1.279 | 1.256 | 1.227 | 1.207 | 1.202 | 1.204 | 1.232 | 1.235 |
| 1997 | 1.236 | 1.230 | 1.205 | 1.199 | 1.200 | 1.198 | 1.174 | 1.224 | 1.231 | 1.197 | 1.171 | 1.131 |
| 1998 | 1.086 | 1.049 | 1.017 | 1.030 | 1.064 | 1.064 | 1.055 | 1.026 | 1.009 | 1.019 | 0.995 | 0.945 |
| 1999 | 0.939 | 0.921 | 0.982 | 1.131 | 1.131 | 1.114 | 1.158 | 1.221 | 1.256 | 1.244 | 1.251 | 1.273 |
| 2000 | 1.289 | 1.377 | 1.516 | 1.465 | 1.487 | 1.633 | 1.551 | 1.465 | 1.550 | 1.532 | 1.517 | 1.443 |
| 2001 | 1.447 | 1.450 | 1.409 | 1.552 | 1.702 | 1.616 | 1.421 | 1.421 | 1.522 | 1.315 | 1.171 | 1.086 |
| 2002 | 1.107 | 1.114 | 1.249 | 1.397 | 1.392 | 1.382 | 1.397 | 1.396 | 1.400 | 1.445 | 1.419 | 1.386 |
| 2003 | 1.458 | 1.613 | 1.693 | 1.589 | 1.497 | 1.493 | 1.513 | 1.620 | 1.679 | 1.564 | 1.512 | 1.479 |
| 2004 | 1.572 | 1.648 | 1.736 | 1.798 | 1.983 | 1.969 | 1.911 | 1.878 | 1.870 | 2.000 | 1.979 | 1.841 |
| 2005 | 1.831 | 1.910 | 2.079 | 2.243 | 2.161 | 2.156 | 2.290 | 2.486 | 2.903 | 2.717 | 2.257 | 2.185 |
| 2006 | 2.316 | 2.280 | 2.425 | 2.742 | 2.907 | 2.885 | 2.981 | 2.952 | 2.555 | 2.245 | 2.229 | 2.313 |
| 2007 | 2.240 | 2.278 | 2.563 | 2.845 | 3.146 | 3.056 | 2.965 | 2.786 | 2.803 | 2.803 | 3.080 | 3.018 |
| 2008 | 3.043 | 3.028 | 3.244 | 3.458 | 3.766 | 4.054 | 4.062 | 3.779 | 3.703 | 3.051 | 2.147 | 1.687 |
| 2009 | 1.788 | 1.923 | 1.959 | 2.049 | 2.266 | 2.631 | 2.527 | 2.616 | 2.554 | 2.551 | 2.651 | 2.607 |
| 2010 | 2.715 | 2.644 | 2.772 | 2.848 | 2.836 | 2.732 | 2.729 | 2.730 | 2.705 | 2.801 | 2.859 | 2.993 |
| 2011 | 3.095 | 3.211 | 3.561 | 3.800 | 3.906 | 3.680 | 3.650 | 3.639 | 3.611 | 3.448 | 3.384 | 3.266 |
| 2012 | 3.380 | 3.579 | 3.852 | 3.900 | 3.732 | 3.539 | 3.439 | 3.722 | 3.849 | 3.746 | 3.452 | 3.310 |
| 2013 | 3.319 | 3.670 | 3.711 | 3.570 | 3.615 | 3.626 | 3.591 | 3.574 | 3.532 | 3.344 | 3.243 | 3.276 |
| 2014 | 3.313 | 3.356 | 3.533 | 3.661 | 3.673 | 3.692 | 3.611 | 3.487 | 3.406 | 3.171 | 2.912 | 2.543 |
| 2015 | 2.116 | 2.216 | 2.464 | 2.469 | 2.718 | 2.802 | 2.794 | 2.636 | 2.365 | 2.290 | 2.158 | 2.038 |
| 2016 | 1.949 | 1.764 | 1.969 | 2.113 | 2.268 | 2.366 | 2.239 | 2.178 | 2.219 | 2.249 | 2.182 | 2.254 |
| 2017 | 2.349 | 2.304 | 2.325 | 2.417 | 2.391 | 2.347 | 2.300 | 2.380 | 2.645 | 2.505 | 2.564 | 2.477 |
| 2018 | 2.555 | 2.587 | 2.591 | 2.757 | 2.901 | 2.891 | 2.849 | 2.836 | 2.836 | 2.860 | 2.647 | 2.366 |
| 2019 | 2.248 | 2.309 | 2.516 | 2.798 | 2.859 | 2.716 | 2.740 | 2.621 | 2.592 | 2.627 | 2.598 | 2.555 |
| 2020 | 2.548 | 2.442 | 2.234 | 1.841 | 1.870 | 2.082 | 2.183 | 2.182 | 2.183 | 2.158 | 2.108 | 2.195 |
| 2021 | 2.334 | 2.501 | 2.810 | 2.858 | 2.985 | 3.064 | 3.136 | 3.158 | 3.175 | 3.291 | 3.395 | 3.307 |
| 2022 | 3.315 | 3.517 | 4.222 | 4.109 | 4.444 | 4.929 | 4.559 | 3.975 | 3.700 | 3.815 | 3.685 | 3.210 |
| 2023 | 3.339 | 3.389 | 3.422 | 3.603 | 3.555 | 3.571 | 3.597 | 3.840 | 3.836 | 3.613 | 3.318 | 3.134 |
| 2024 | 3.075 | 3.212 | 3.426 | |||||||||
| - = No Data Reported; -- = Not Applicable; NA = Not Available; W = Withheld to avoid disclosure of individual company data. |
| Release Date: 4/22/2024 |
| Next Release Date: 4/29/2024 |
Referring Pages: