|
Download Data (XLS File) |
|
||||||||||
|
||||||||||
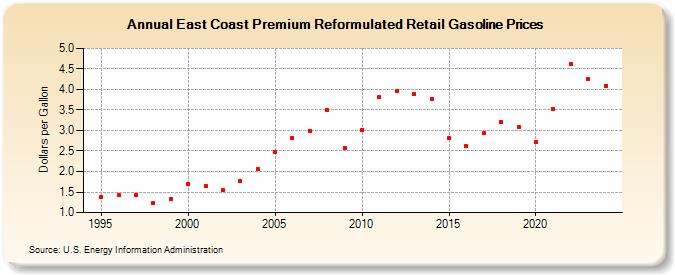
| East Coast Premium Reformulated Retail Gasoline Prices (Dollars per Gallon) | ||||||||||
| Decade | Year-0 | Year-1 | Year-2 | Year-3 | Year-4 | Year-5 | Year-6 | Year-7 | Year-8 | Year-9 |
|---|---|---|---|---|---|---|---|---|---|---|
| 1990's | NA | 1.374 | 1.427 | 1.428 | 1.235 | 1.321 | ||||
| 2000's | 1.691 | 1.636 | 1.542 | 1.775 | 2.058 | 2.484 | 2.823 | 2.991 | 3.494 | 2.582 |
| 2010's | 3.020 | 3.813 | 3.960 | 3.888 | 3.761 | 2.816 | 2.615 | 2.933 | 3.217 | 3.082 |
| 2020's | 2.725 | 3.527 | 4.616 | 4.257 |
| - = No Data Reported; -- = Not Applicable; NA = Not Available; W = Withheld to avoid disclosure of individual company data. |
| Release Date: 4/22/2024 |
| Next Release Date: 4/29/2024 |