|
Download Data (XLS File) |
|
||||||||||
|
||||||||||
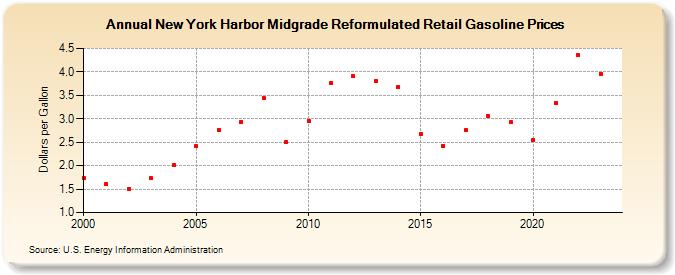
| New York Harbor Midgrade Reformulated Retail Gasoline Prices (Dollars per Gallon) | ||||||||||
| Decade | Year-0 | Year-1 | Year-2 | Year-3 | Year-4 | Year-5 | Year-6 | Year-7 | Year-8 | Year-9 |
|---|---|---|---|---|---|---|---|---|---|---|
| 2000's | 1.729 | 1.607 | 1.498 | 1.731 | 2.010 | 2.415 | 2.758 | 2.933 | 3.445 | 2.512 |
| 2010's | 2.960 | 3.770 | 3.906 | 3.812 | 3.672 | 2.671 | 2.425 | 2.758 | 3.051 | 2.924 |
| 2020's | 2.545 | 3.341 | 4.355 | 3.964 |
| - = No Data Reported; -- = Not Applicable; NA = Not Available; W = Withheld to avoid disclosure of individual company data. |
| Release Date: 4/15/2024 |
| Next Release Date: 4/22/2024 |