|
Download Data (XLS File) |
|
||||||||||
|
||||||||||
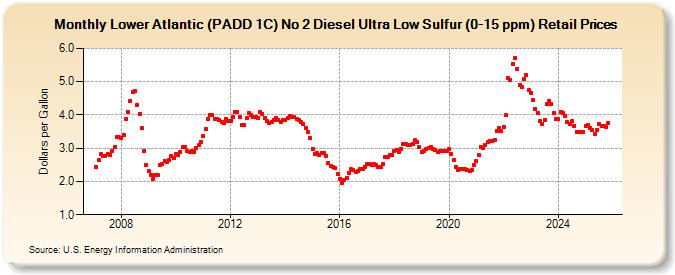
| Lower Atlantic (PADD 1C) No 2 Diesel Ultra Low Sulfur (0-15 ppm) Retail Prices (Dollars per Gallon) | ||||||||||
| Year | Jan | Feb | Mar | Apr | May | Jun | Jul | Aug | Sep | Oct | Nov | Dec |
|---|---|---|---|---|---|---|---|---|---|---|---|---|
| 2007 | 2.434 | 2.632 | 2.817 | 2.775 | 2.779 | 2.819 | 2.809 | 2.910 | 3.022 | 3.341 | 3.326 | |
| 2008 | 3.320 | 3.383 | 3.876 | 4.077 | 4.415 | 4.679 | 4.720 | 4.303 | 4.036 | 3.611 | 2.923 | 2.493 |
| 2009 | 2.305 | 2.183 | 2.082 | 2.201 | 2.207 | 2.507 | 2.511 | 2.623 | 2.587 | 2.633 | 2.765 | 2.715 |
| 2010 | 2.836 | 2.782 | 2.894 | 3.024 | 3.035 | 2.914 | 2.875 | 2.918 | 2.895 | 2.997 | 3.084 | 3.196 |
| 2011 | 3.371 | 3.571 | 3.876 | 4.009 | 3.991 | 3.890 | 3.884 | 3.837 | 3.797 | 3.749 | 3.881 | 3.807 |
| 2012 | 3.824 | 3.951 | 4.102 | 4.079 | 3.940 | 3.699 | 3.686 | 3.918 | 4.043 | 3.997 | 3.937 | 3.938 |
| 2013 | 3.910 | 4.087 | 4.037 | 3.902 | 3.803 | 3.764 | 3.802 | 3.847 | 3.902 | 3.833 | 3.797 | 3.844 |
| 2014 | 3.840 | 3.903 | 3.965 | 3.949 | 3.926 | 3.888 | 3.850 | 3.794 | 3.735 | 3.615 | 3.485 | 3.303 |
| 2015 | 2.984 | 2.836 | 2.857 | 2.784 | 2.866 | 2.842 | 2.768 | 2.568 | 2.461 | 2.431 | 2.390 | 2.231 |
| 2016 | 2.085 | 1.957 | 2.052 | 2.113 | 2.268 | 2.364 | 2.334 | 2.278 | 2.323 | 2.369 | 2.366 | 2.448 |
| 2017 | 2.514 | 2.520 | 2.506 | 2.516 | 2.498 | 2.443 | 2.427 | 2.522 | 2.748 | 2.724 | 2.786 | 2.786 |
| 2018 | 2.910 | 2.950 | 2.880 | 2.989 | 3.133 | 3.130 | 3.101 | 3.089 | 3.129 | 3.233 | 3.176 | 3.025 |
| 2019 | 2.900 | 2.907 | 2.986 | 3.019 | 3.034 | 2.978 | 2.937 | 2.898 | 2.908 | 2.921 | 2.917 | 2.930 |
| 2020 | 2.962 | 2.813 | 2.634 | 2.443 | 2.353 | 2.363 | 2.382 | 2.370 | 2.348 | 2.322 | 2.336 | 2.493 |
| 2021 | 2.604 | 2.784 | 3.043 | 2.998 | 3.091 | 3.178 | 3.210 | 3.213 | 3.260 | 3.512 | 3.611 | 3.515 |
| 2022 | 3.622 | 3.990 | 5.110 | 5.058 | 5.541 | 5.726 | 5.393 | 4.898 | 4.842 | 5.065 | 5.188 | 4.743 |
| 2023 | 4.671 | 4.459 | 4.171 | 4.048 | 3.816 | 3.729 | 3.843 | 4.343 | 4.430 | 4.322 | 4.052 | 3.886 |
| 2024 | 3.868 | 4.095 | 4.050 | |||||||||
| - = No Data Reported; -- = Not Applicable; NA = Not Available; W = Withheld to avoid disclosure of individual company data. |
| Release Date: 4/15/2024 |
| Next Release Date: 4/22/2024 |