|
Download Data (XLS File) |
|
||||||||||
|
||||||||||
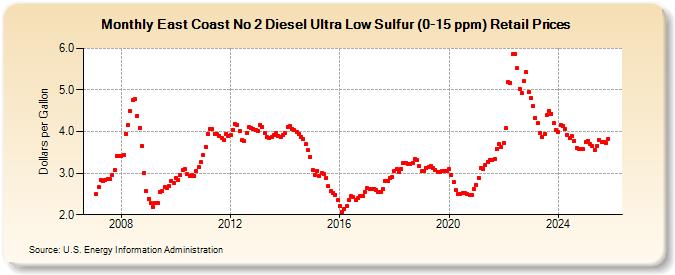
| East Coast No 2 Diesel Ultra Low Sulfur (0-15 ppm) Retail Prices (Dollars per Gallon) | ||||||||||
| Year | Jan | Feb | Mar | Apr | May | Jun | Jul | Aug | Sep | Oct | Nov | Dec |
|---|---|---|---|---|---|---|---|---|---|---|---|---|
| 2007 | 2.490 | 2.662 | 2.833 | 2.813 | 2.823 | 2.867 | 2.852 | 2.954 | 3.081 | 3.403 | 3.411 | |
| 2008 | 3.402 | 3.445 | 3.951 | 4.161 | 4.491 | 4.749 | 4.775 | 4.384 | 4.095 | 3.663 | 3.013 | 2.569 |
| 2009 | 2.387 | 2.285 | 2.175 | 2.273 | 2.274 | 2.553 | 2.562 | 2.666 | 2.640 | 2.686 | 2.815 | 2.768 |
| 2010 | 2.893 | 2.839 | 2.948 | 3.071 | 3.088 | 2.971 | 2.928 | 2.959 | 2.938 | 3.050 | 3.140 | 3.257 |
| 2011 | 3.429 | 3.634 | 3.936 | 4.070 | 4.059 | 3.950 | 3.937 | 3.894 | 3.856 | 3.808 | 3.944 | 3.891 |
| 2012 | 3.916 | 4.041 | 4.178 | 4.167 | 4.025 | 3.797 | 3.768 | 3.975 | 4.109 | 4.090 | 4.054 | 4.041 |
| 2013 | 4.008 | 4.160 | 4.105 | 3.964 | 3.866 | 3.841 | 3.875 | 3.916 | 3.969 | 3.902 | 3.861 | 3.919 |
| 2014 | 3.958 | 4.116 | 4.132 | 4.070 | 4.036 | 3.985 | 3.944 | 3.881 | 3.819 | 3.690 | 3.557 | 3.384 |
| 2015 | 3.081 | 2.957 | 3.058 | 2.935 | 2.999 | 2.972 | 2.884 | 2.683 | 2.563 | 2.525 | 2.486 | 2.346 |
| 2016 | 2.201 | 2.076 | 2.145 | 2.208 | 2.344 | 2.443 | 2.415 | 2.353 | 2.398 | 2.451 | 2.454 | 2.538 |
| 2017 | 2.632 | 2.627 | 2.609 | 2.622 | 2.605 | 2.556 | 2.538 | 2.619 | 2.810 | 2.803 | 2.884 | 2.902 |
| 2018 | 3.052 | 3.096 | 3.029 | 3.110 | 3.243 | 3.250 | 3.228 | 3.217 | 3.247 | 3.350 | 3.304 | 3.166 |
| 2019 | 3.051 | 3.059 | 3.125 | 3.157 | 3.177 | 3.114 | 3.074 | 3.028 | 3.028 | 3.047 | 3.050 | 3.062 |
| 2020 | 3.088 | 2.959 | 2.788 | 2.589 | 2.499 | 2.507 | 2.524 | 2.513 | 2.492 | 2.468 | 2.485 | 2.622 |
| 2021 | 2.724 | 2.884 | 3.126 | 3.101 | 3.195 | 3.275 | 3.310 | 3.316 | 3.348 | 3.589 | 3.702 | 3.626 |
| 2022 | 3.720 | 4.077 | 5.183 | 5.174 | 5.861 | 5.868 | 5.520 | 5.031 | 4.927 | 5.211 | 5.424 | 4.963 |
| 2023 | 4.812 | 4.606 | 4.330 | 4.194 | 3.958 | 3.857 | 3.934 | 4.387 | 4.504 | 4.431 | 4.198 | 4.045 |
| 2024 | 3.995 | 4.167 | 4.131 | |||||||||
| - = No Data Reported; -- = Not Applicable; NA = Not Available; W = Withheld to avoid disclosure of individual company data. |
| Release Date: 4/15/2024 |
| Next Release Date: 4/22/2024 |