|
Download Data (XLS File) |
|
||||||||||
|
||||||||||
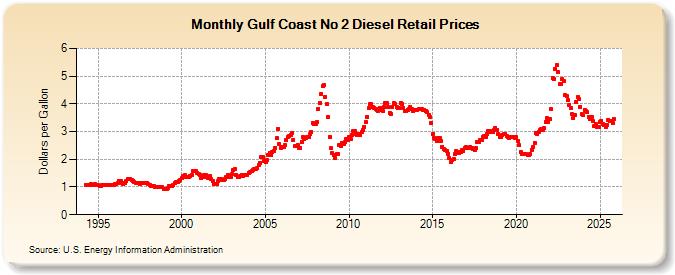
| Gulf Coast No 2 Diesel Retail Prices (Dollars per Gallon) | ||||||||||
| Year | Jan | Feb | Mar | Apr | May | Jun | Jul | Aug | Sep | Oct | Nov | Dec |
|---|---|---|---|---|---|---|---|---|---|---|---|---|
| 1994 | NA | 1.064 | 1.054 | 1.062 | 1.076 | 1.092 | 1.089 | 1.081 | 1.092 | 1.074 | ||
| 1995 | 1.059 | 1.050 | 1.046 | 1.066 | 1.086 | 1.080 | 1.060 | 1.063 | 1.084 | 1.072 | 1.073 | 1.085 |
| 1996 | 1.106 | 1.105 | 1.151 | 1.227 | 1.201 | 1.141 | 1.119 | 1.149 | 1.215 | 1.288 | 1.281 | 1.271 |
| 1997 | 1.255 | 1.230 | 1.176 | 1.159 | 1.156 | 1.145 | 1.126 | 1.139 | 1.130 | 1.157 | 1.162 | 1.141 |
| 1998 | 1.102 | 1.065 | 1.041 | 1.045 | 1.044 | 1.017 | 1.007 | 0.985 | 0.998 | 1.017 | 0.997 | 0.945 |
| 1999 | 0.940 | 0.934 | 0.964 | 1.043 | 1.036 | 1.028 | 1.082 | 1.132 | 1.181 | 1.190 | 1.218 | 1.257 |
| 2000 | 1.321 | 1.394 | 1.426 | 1.369 | 1.369 | 1.368 | 1.390 | 1.428 | 1.586 | 1.580 | 1.574 | 1.496 |
| 2001 | 1.457 | 1.441 | 1.339 | 1.358 | 1.420 | 1.433 | 1.345 | 1.331 | 1.414 | 1.284 | 1.199 | 1.123 |
| 2002 | 1.121 | 1.122 | 1.200 | 1.273 | 1.272 | 1.247 | 1.262 | 1.290 | 1.369 | 1.430 | 1.363 | 1.377 |
| 2003 | 1.459 | 1.621 | 1.637 | 1.443 | 1.375 | 1.367 | 1.383 | 1.435 | 1.407 | 1.428 | 1.431 | 1.442 |
| 2004 | 1.516 | 1.530 | 1.568 | 1.616 | 1.654 | 1.634 | 1.669 | 1.780 | 1.871 | 2.073 | 2.080 | 1.939 |
| 2005 | 1.906 | 1.958 | 2.148 | 2.226 | 2.150 | 2.256 | 2.314 | 2.421 | 2.766 | 3.107 | 2.553 | 2.424 |
| 2006 | 2.434 | 2.445 | 2.519 | 2.681 | 2.815 | 2.834 | 2.880 | 2.952 | 2.701 | 2.467 | 2.470 | 2.528 |
| 2007 | 2.412 | 2.417 | 2.629 | 2.801 | 2.745 | 2.756 | 2.799 | 2.803 | 2.894 | 2.984 | 3.313 | 3.279 |
| 2008 | 3.256 | 3.341 | 3.831 | 4.021 | 4.367 | 4.637 | 4.676 | 4.251 | 3.989 | 3.537 | 2.818 | 2.394 |
| 2009 | 2.225 | 2.138 | 2.057 | 2.192 | 2.201 | 2.498 | 2.494 | 2.588 | 2.549 | 2.608 | 2.738 | 2.699 |
| 2010 | 2.807 | 2.746 | 2.878 | 3.018 | 3.025 | 2.894 | 2.864 | 2.914 | 2.884 | 2.967 | 3.055 | 3.176 |
| 2011 | 3.339 | 3.531 | 3.838 | 3.991 | 3.979 | 3.876 | 3.862 | 3.823 | 3.771 | 3.725 | 3.860 | 3.764 |
| 2012 | 3.757 | 3.878 | 4.041 | 4.025 | 3.885 | 3.678 | 3.639 | 3.875 | 4.018 | 3.993 | 3.891 | 3.857 |
| 2013 | 3.834 | 4.024 | 4.006 | 3.843 | 3.756 | 3.750 | 3.794 | 3.829 | 3.875 | 3.796 | 3.755 | 3.776 |
| 2014 | 3.781 | 3.788 | 3.803 | 3.807 | 3.796 | 3.790 | 3.782 | 3.744 | 3.704 | 3.613 | 3.537 | 3.312 |
| 2015 | 2.910 | 2.777 | 2.749 | 2.651 | 2.780 | 2.769 | 2.676 | 2.458 | 2.353 | 2.322 | 2.289 | 2.191 |
| 2016 | 2.041 | 1.884 | 1.972 | 2.024 | 2.182 | 2.292 | 2.262 | 2.221 | 2.248 | 2.326 | 2.311 | 2.391 |
| 2017 | 2.430 | 2.423 | 2.402 | 2.444 | 2.407 | 2.355 | 2.329 | 2.414 | 2.631 | 2.616 | 2.692 | 2.706 |
| 2018 | 2.813 | 2.835 | 2.796 | 2.897 | 3.019 | 3.022 | 3.000 | 2.993 | 3.046 | 3.138 | 3.068 | 2.907 |
| 2019 | 2.797 | 2.803 | 2.874 | 2.901 | 2.908 | 2.834 | 2.802 | 2.761 | 2.786 | 2.804 | 2.790 | 2.774 |
| 2020 | 2.802 | 2.674 | 2.502 | 2.274 | 2.174 | 2.182 | 2.196 | 2.179 | 2.167 | 2.145 | 2.181 | 2.339 |
| 2021 | 2.443 | 2.604 | 2.940 | 2.925 | 2.995 | 3.040 | 3.080 | 3.070 | 3.116 | 3.361 | 3.471 | 3.361 |
| 2022 | 3.463 | 3.804 | 4.937 | 4.885 | 5.248 | 5.393 | 5.135 | 4.706 | 4.717 | 4.885 | 4.826 | 4.309 |
| 2023 | 4.277 | 4.132 | 3.959 | 3.867 | 3.619 | 3.500 | 3.590 | 4.080 | 4.254 | 4.167 | 3.898 | 3.639 |
| 2024 | 3.583 | 3.795 | 3.724 | |||||||||
| - = No Data Reported; -- = Not Applicable; NA = Not Available; W = Withheld to avoid disclosure of individual company data. |
| Release Date: 4/15/2024 |
| Next Release Date: 4/22/2024 |