|
Download Data (XLS File) |
|
||||||||
|
||||||||
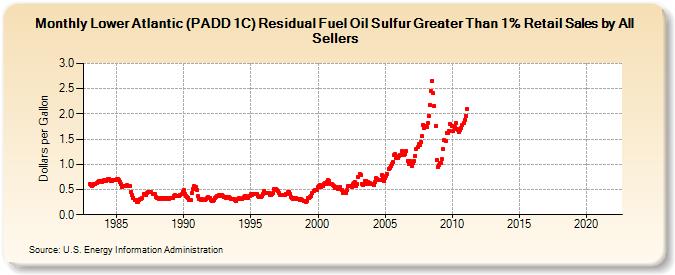
| Lower Atlantic (PADD 1C) Residual Fuel Oil Sulfur Greater Than 1% Retail Sales by All Sellers (Dollars per Gallon) | ||||||||
| Year | Jan | Feb | Mar | Apr | May | Jun | Jul | Aug | Sep | Oct | Nov | Dec |
|---|---|---|---|---|---|---|---|---|---|---|---|---|
| 1983 | 0.609 | 0.596 | 0.572 | 0.596 | 0.609 | 0.614 | 0.629 | 0.648 | 0.666 | 0.665 | 0.663 | 0.658 |
| 1984 | 0.674 | 0.688 | 0.668 | 0.686 | 0.700 | 0.709 | 0.693 | 0.667 | 0.677 | 0.680 | 0.685 | 0.690 |
| 1985 | 0.702 | 0.699 | 0.683 | 0.650 | 0.604 | 0.551 | 0.575 | 0.568 | 0.577 | 0.580 | 0.561 | 0.575 |
| 1986 | 0.566 | 0.458 | 0.389 | 0.338 | 0.301 | 0.297 | 0.261 | 0.262 | 0.298 | 0.303 | 0.321 | 0.338 |
| 1987 | 0.412 | 0.411 | 0.388 | 0.424 | 0.442 | 0.451 | 0.460 | 0.450 | 0.417 | 0.414 | 0.407 | 0.351 |
| 1988 | 0.340 | 0.336 | 0.308 | 0.310 | 0.328 | 0.332 | 0.317 | 0.325 | 0.325 | 0.328 | 0.317 | 0.315 |
| 1989 | 0.338 | 0.326 | 0.333 | 0.375 | 0.394 | 0.379 | 0.379 | 0.374 | 0.365 | 0.394 | 0.401 | 0.456 |
| 1990 | 0.490 | 0.418 | 0.374 | 0.349 | 0.340 | 0.298 | 0.299 | 0.429 | 0.515 | 0.564 | 0.554 | 0.547 |
| 1991 | 0.492 | 0.362 | 0.309 | 0.300 | 0.306 | 0.294 | 0.298 | 0.297 | 0.306 | 0.322 | 0.343 | 0.326 |
| 1992 | 0.294 | 0.278 | 0.271 | 0.297 | 0.336 | 0.351 | 0.375 | 0.386 | 0.372 | 0.399 | 0.397 | 0.364 |
| 1993 | 0.343 | 0.344 | 0.340 | 0.348 | 0.356 | 0.340 | 0.312 | 0.311 | 0.313 | 0.313 | 0.286 | 0.267 |
| 1994 | 0.304 | 0.329 | 0.309 | 0.302 | 0.310 | 0.332 | 0.360 | 0.370 | 0.328 | 0.334 | 0.364 | 0.381 |
| 1995 | 0.405 | 0.399 | 0.407 | 0.401 | 0.420 | 0.420 | 0.373 | 0.349 | 0.349 | 0.357 | 0.366 | 0.415 |
| 1996 | 0.479 | 0.427 | 0.433 | 0.433 | 0.429 | 0.398 | 0.396 | 0.408 | 0.432 | 0.501 | 0.515 | 0.491 |
| 1997 | 0.469 | 0.428 | 0.392 | 0.392 | 0.388 | 0.398 | 0.394 | 0.408 | 0.416 | 0.454 | 0.458 | 0.415 |
| 1998 | 0.353 | 0.338 | 0.303 | 0.339 | 0.334 | 0.308 | 0.321 | 0.304 | 0.289 | 0.303 | 0.293 | 0.265 |
| 1999 | 0.281 | 0.261 | 0.279 | 0.329 | 0.341 | 0.344 | 0.378 | 0.434 | 0.476 | 0.488 | 0.484 | 0.491 |
| 2000 | 0.544 | 0.577 | 0.585 | 0.548 | 0.578 | 0.610 | 0.624 | 0.600 | 0.656 | 0.682 | 0.669 | 0.619 |
| 2001 | 0.607 | 0.598 | 0.570 | 0.522 | 0.556 | 0.530 | 0.507 | 0.507 | 0.543 | 0.487 | 0.439 | 0.442 |
| 2002 | 0.433 | 0.435 | 0.487 | 0.560 | 0.560 | 0.567 | 0.555 | 0.603 | 0.637 | 0.641 | 0.564 | 0.603 |
| 2003 | 0.756 | 0.804 | 0.796 | 0.613 | 0.588 | 0.611 | 0.675 | 0.678 | 0.612 | 0.645 | 0.632 | 0.617 |
| 2004 | 0.619 | 0.616 | 0.598 | 0.640 | 0.721 | 0.714 | 0.685 | 0.680 | 0.687 | 0.786 | 0.754 | 0.662 |
| 2005 | 0.719 | 0.776 | 0.812 | 0.903 | 0.930 | 0.960 | 0.997 | 1.051 | 1.179 | 1.200 | 1.125 | 1.132 |
| 2006 | 1.156 | 1.186 | 1.179 | 1.266 | 1.233 | 1.193 | 1.201 | 1.255 | 1.066 | 1.000 | 1.073 | 1.046 |
| 2007 | 0.974 | 1.028 | 1.069 | 1.174 | 1.305 | 1.335 | 1.397 | 1.384 | 1.442 | 1.554 | 1.785 | 1.720 |
| 2008 | 1.754 | 1.736 | 1.812 | 1.964 | 2.177 | 2.449 | 2.658 | 2.408 | 2.154 | 1.757 | 1.092 | 0.954 |
| 2009 | 0.984 | 1.027 | 1.021 | 1.097 | 1.303 | 1.476 | 1.457 | 1.628 | 1.614 | 1.653 | 1.808 | NA |
| 2010 | 1.756 | 1.668 | 1.732 | 1.816 | 1.701 | 1.685 | 1.644 | 1.688 | 1.718 | 1.777 | 1.821 | 1.875 |
| 2011 | 1.968 | 2.099 | - | - | - | - | - | - | - | - | - | - |
| 2012 | - | - | - | - | - | - | - | - | - | - | - | - |
| 2013 | - | - | - | - | - | - | - | - | - | - | - | - |
| 2014 | - | - | - | - | - | - | - | - | - | - | - | - |
| 2015 | - | - | - | - | - | - | - | - | - | - | - | - |
| 2016 | - | - | - | - | - | - | - | - | - | - | - | - |
| 2017 | - | - | - | - | - | - | - | - | - | - | - | - |
| 2018 | - | - | - | - | - | - | - | - | - | - | - | - |
| 2019 | - | - | - | - | - | - | - | - | - | - | - | - |
| 2020 | - | - | - | - | - | - | - | - | - | - | - | - |
| 2021 | - | - | - | - | - | - | - | - | - | - | - | - |
| 2022 | - | - | - | |||||||||
| - = No Data Reported; -- = Not Applicable; NA = Not Available; W = Withheld to avoid disclosure of individual company data. |
| Release Date: 6/1/2022 |
| Next Release Date: TBD |