|
Download Data (XLS File) |
|
||||||||
|
||||||||
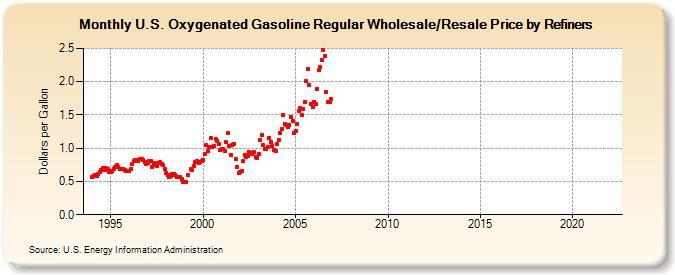
| U.S. Oxygenated Gasoline Regular Wholesale/Resale Price by Refiners (Dollars per Gallon) | ||||||||
| Year | Jan | Feb | Mar | Apr | May | Jun | Jul | Aug | Sep | Oct | Nov | Dec |
|---|---|---|---|---|---|---|---|---|---|---|---|---|
| 1994 | 0.563 | 0.578 | 0.591 | 0.583 | 0.616 | 0.638 | 0.674 | 0.700 | 0.678 | 0.695 | 0.694 | 0.637 |
| 1995 | 0.647 | 0.660 | 0.689 | 0.715 | 0.752 | 0.719 | 0.685 | 0.687 | 0.694 | 0.668 | 0.653 | 0.655 |
| 1996 | 0.656 | 0.682 | 0.758 | 0.800 | 0.823 | 0.823 | 0.806 | 0.832 | 0.832 | 0.820 | 0.793 | 0.761 |
| 1997 | 0.783 | 0.807 | 0.804 | 0.723 | 0.780 | 0.747 | 0.725 | 0.784 | 0.786 | 0.760 | 0.742 | 0.688 |
| 1998 | 0.634 | 0.600 | 0.560 | 0.578 | 0.619 | 0.610 | 0.604 | 0.564 | 0.566 | 0.561 | 0.531 | 0.486 |
| 1999 | 0.498 | 0.487 | 0.592 | NA | 0.685 | 0.665 | 0.735 | 0.795 | 0.810 | 0.783 | 0.794 | 0.806 |
| 2000 | 0.825 | 0.913 | 1.047 | 0.958 | 1.021 | 1.147 | 1.014 | 1.034 | 1.132 | 1.111 | 1.066 | 0.966 |
| 2001 | 0.993 | 0.993 | 0.960 | 1.089 | 1.222 | 1.032 | 0.905 | 1.042 | 1.070 | 0.844 | 0.722 | 0.628 |
| 2002 | 0.645 | 0.655 | 0.800 | 0.894 | 0.872 | 0.877 | 0.939 | 0.934 | 0.919 | 0.948 | 0.867 | 0.854 |
| 2003 | 0.915 | 1.117 | 1.191 | 1.045 | 0.990 | 0.987 | 1.023 | 1.156 | 1.088 | 1.034 | 0.977 | 0.960 |
| 2004 | 1.056 | 1.130 | 1.227 | 1.289 | 1.501 | 1.360 | 1.351 | 1.315 | 1.346 | 1.465 | 1.406 | 1.221 |
| 2005 | 1.263 | 1.358 | 1.558 | 1.598 | 1.499 | 1.595 | 1.688 | 2.005 | 2.188 | 1.943 | 1.662 | 1.614 |
| 2006 | 1.696 | 1.670 | 1.893 | 2.177 | 2.217 | 2.321 | 2.470 | 2.389 | 1.842 | 1.688 | 1.698 | 1.735 |
| 2007 | - | - | - | - | - | - | - | - | - | - | - | - |
| 2008 | - | - | - | - | - | - | - | - | - | - | - | - |
| 2009 | - | - | - | - | - | - | - | - | - | - | - | - |
| 2010 | - | - | - | - | - | - | - | - | - | - | - | - |
| 2011 | - | - | - | - | - | - | - | - | - | - | - | - |
| 2012 | - | - | - | - | - | - | - | - | - | - | - | - |
| 2013 | - | - | - | - | - | - | - | - | - | - | - | - |
| 2014 | - | - | - | - | - | - | - | - | - | - | - | - |
| 2015 | - | - | - | - | - | - | - | - | - | - | - | - |
| 2016 | - | - | - | - | - | - | - | - | - | - | - | - |
| 2017 | - | - | - | - | - | - | - | - | - | - | - | - |
| 2018 | - | - | - | - | - | - | - | - | - | - | - | - |
| 2019 | - | - | - | - | - | - | - | - | - | - | - | - |
| 2020 | - | - | - | - | - | - | - | - | - | - | - | - |
| 2021 | - | - | - | - | - | - | - | - | - | - | - | - |
| 2022 | - | - | - | |||||||||
| - = No Data Reported; -- = Not Applicable; NA = Not Available; W = Withheld to avoid disclosure of individual company data. |
| Release Date: 6/1/2022 |
| Next Release Date: TBD |