|
Download Data (XLS File) |
|
||||||||
|
||||||||
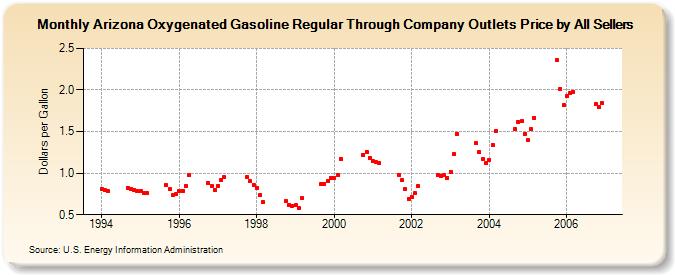
| Arizona Oxygenated Gasoline Regular Through Company Outlets Price by All Sellers (Dollars per Gallon) | ||||||||
| Year | Jan | Feb | Mar | Apr | May | Jun | Jul | Aug | Sep | Oct | Nov | Dec |
|---|---|---|---|---|---|---|---|---|---|---|---|---|
| 1994 | 0.811 | 0.792 | 0.782 | W | W | W | W | W | 0.824 | 0.808 | 0.798 | 0.788 |
| 1995 | 0.781 | 0.766 | 0.763 | W | - | - | - | - | 0.856 | 0.805 | 0.736 | 0.745 |
| 1996 | 0.785 | 0.790 | 0.848 | 0.974 | - | - | - | - | W | 0.881 | 0.847 | 0.795 |
| 1997 | 0.849 | 0.922 | 0.952 | W | - | - | - | - | W | 0.948 | 0.905 | 0.861 |
| 1998 | 0.825 | 0.739 | 0.651 | W | - | - | - | - | W | 0.666 | 0.616 | 0.605 |
| 1999 | 0.611 | 0.575 | 0.706 | W | W | W | NA | NA | 0.865 | 0.872 | 0.903 | 0.942 |
| 2000 | 0.946 | 0.972 | 1.174 | - | - | - | - | - | W | 1.222 | 1.256 | 1.185 |
| 2001 | 1.141 | 1.130 | 1.119 | W | - | - | - | - | 0.977 | 0.912 | 0.805 | 0.690 |
| 2002 | 0.714 | 0.757 | 0.843 | W | - | - | - | - | 0.979 | 0.963 | 0.976 | 0.947 |
| 2003 | 1.018 | 1.232 | 1.476 | W | - | - | - | - | 1.358 | 1.254 | 1.170 | 1.123 |
| 2004 | 1.162 | 1.336 | 1.506 | W | - | - | - | - | 1.525 | 1.620 | 1.625 | 1.467 |
| 2005 | 1.395 | 1.527 | 1.666 | - | - | - | - | - | W | 2.355 | 2.013 | 1.817 |
| 2006 | 1.925 | 1.959 | 1.981 | - | - | - | - | - | W | 1.827 | 1.791 | 1.842 |
| - = No Data Reported; -- = Not Applicable; NA = Not Available; W = Withheld to avoid disclosure of individual company data. |
| Release Date: 6/1/2022 |
| Next Release Date: TBD |