|
Download Data (XLS File) |
|
||||||||
|
||||||||
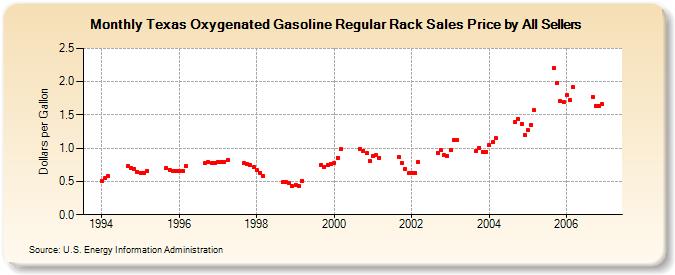
| Texas Oxygenated Gasoline Regular Rack Sales Price by All Sellers (Dollars per Gallon) | ||||||||
| Year | Jan | Feb | Mar | Apr | May | Jun | Jul | Aug | Sep | Oct | Nov | Dec |
|---|---|---|---|---|---|---|---|---|---|---|---|---|
| 1994 | 0.508 | 0.546 | 0.575 | W | W | - | - | W | 0.727 | 0.700 | 0.691 | 0.645 |
| 1995 | 0.627 | 0.630 | 0.660 | NA | - | - | - | - | 0.705 | 0.676 | 0.664 | 0.660 |
| 1996 | 0.656 | 0.661 | 0.729 | - | - | - | - | - | 0.780 | 0.787 | 0.780 | 0.780 |
| 1997 | 0.796 | 0.797 | 0.793 | 0.819 | - | - | - | - | 0.775 | 0.765 | 0.742 | 0.710 |
| 1998 | 0.665 | 0.627 | 0.583 | - | - | - | - | - | 0.485 | 0.497 | 0.476 | 0.426 |
| 1999 | 0.447 | 0.435 | 0.512 | - | - | - | - | - | 0.745 | 0.719 | 0.749 | 0.767 |
| 2000 | 0.779 | 0.859 | 0.983 | W | - | - | - | - | 0.989 | 0.965 | 0.926 | 0.809 |
| 2001 | 0.878 | 0.891 | 0.858 | W | W | - | - | - | 0.866 | 0.783 | 0.690 | 0.622 |
| 2002 | 0.624 | 0.633 | 0.790 | W | - | - | - | - | 0.929 | 0.966 | 0.893 | 0.879 |
| 2003 | 0.971 | 1.119 | 1.121 | W | - | - | - | - | 0.963 | 1.008 | 0.950 | 0.947 |
| 2004 | 1.044 | 1.086 | 1.151 | - | - | - | - | - | 1.394 | 1.440 | 1.370 | 1.205 |
| 2005 | 1.269 | 1.354 | 1.570 | - | - | - | - | NA | 2.205 | 1.980 | 1.703 | 1.696 |
| 2006 | 1.792 | 1.724 | 1.923 | - | - | - | - | - | 1.776 | 1.641 | 1.634 | 1.658 |
| - = No Data Reported; -- = Not Applicable; NA = Not Available; W = Withheld to avoid disclosure of individual company data. |
| Release Date: 6/1/2022 |
| Next Release Date: TBD |