|
Download Data (XLS File) |
|
||||||||
|
||||||||
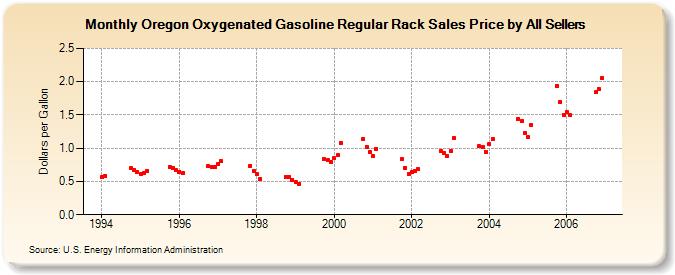
| Oregon Oxygenated Gasoline Regular Rack Sales Price by All Sellers (Dollars per Gallon) | ||||||||
| Year | Jan | Feb | Mar | Apr | May | Jun | Jul | Aug | Sep | Oct | Nov | Dec |
|---|---|---|---|---|---|---|---|---|---|---|---|---|
| 1994 | 0.566 | 0.586 | W | W | - | - | - | - | - | 0.697 | 0.674 | 0.639 |
| 1995 | 0.619 | 0.621 | 0.658 | - | - | - | - | - | - | 0.716 | 0.703 | 0.672 |
| 1996 | 0.649 | 0.620 | - | - | - | - | - | - | - | 0.727 | 0.718 | 0.712 |
| 1997 | 0.763 | 0.800 | - | W | W | W | W | W | W | NA | 0.736 | 0.659 |
| 1998 | 0.608 | 0.544 | W | W | W | W | W | W | W | 0.570 | 0.568 | 0.529 |
| 1999 | 0.485 | 0.468 | W | - | - | - | - | - | - | 0.839 | 0.818 | 0.798 |
| 2000 | 0.851 | 0.896 | 1.084 | W | W | W | W | W | W | 1.143 | 1.025 | 0.942 |
| 2001 | 0.882 | 0.993 | W | - | W | - | - | - | - | 0.836 | 0.703 | 0.615 |
| 2002 | 0.642 | 0.664 | 0.684 | W | - | - | - | - | - | 0.958 | 0.935 | 0.877 |
| 2003 | 0.959 | 1.155 | W | W | - | W | W | W | W | 1.028 | 1.020 | 0.947 |
| 2004 | 1.059 | 1.141 | W | W | W | W | W | W | NA | 1.445 | 1.409 | 1.228 |
| 2005 | 1.162 | 1.349 | NA | W | W | W | W | W | W | 1.938 | 1.693 | 1.498 |
| 2006 | 1.541 | 1.494 | W | W | W | - | - | - | - | 1.840 | 1.884 | 2.054 |
| - = No Data Reported; -- = Not Applicable; NA = Not Available; W = Withheld to avoid disclosure of individual company data. |
| Release Date: 6/1/2022 |
| Next Release Date: TBD |