|
Download Data (XLS File) |
|
||||||||
|
||||||||
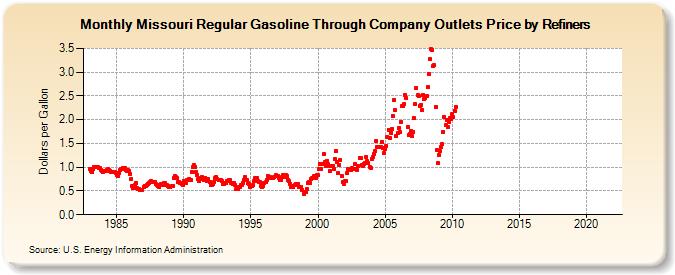
| Missouri Regular Gasoline Through Company Outlets Price by Refiners (Dollars per Gallon) | ||||||||
| Year | Jan | Feb | Mar | Apr | May | Jun | Jul | Aug | Sep | Oct | Nov | Dec |
|---|---|---|---|---|---|---|---|---|---|---|---|---|
| 1983 | 0.969 | 0.928 | 0.900 | 0.964 | 0.997 | 0.997 | 1.003 | 0.994 | 0.991 | 0.979 | 0.950 | 0.926 |
| 1984 | 0.906 | 0.912 | 0.918 | 0.951 | 0.954 | 0.945 | 0.923 | 0.900 | 0.904 | 0.906 | 0.899 | 0.880 |
| 1985 | 0.833 | 0.814 | 0.870 | 0.944 | 0.962 | 0.971 | 0.978 | 0.974 | 0.947 | 0.916 | 0.933 | 0.927 |
| 1986 | 0.865 | 0.754 | 0.603 | 0.561 | 0.629 | 0.658 | 0.563 | 0.537 | 0.551 | 0.519 | 0.527 | 0.527 |
| 1987 | 0.588 | 0.606 | 0.610 | 0.635 | 0.650 | 0.675 | 0.688 | 0.704 | 0.687 | 0.687 | 0.690 | 0.646 |
| 1988 | 0.620 | 0.608 | 0.592 | 0.629 | 0.652 | 0.635 | 0.659 | 0.666 | 0.625 | 0.616 | 0.614 | 0.587 |
| 1989 | 0.578 | 0.594 | 0.607 | 0.768 | 0.807 | 0.787 | 0.763 | 0.682 | 0.687 | 0.674 | 0.651 | 0.626 |
| 1990 | 0.716 | 0.683 | 0.665 | 0.734 | 0.741 | 0.752 | 0.741 | 0.907 | 0.994 | 1.049 | 1.008 | 0.909 |
| 1991 | 0.837 | 0.750 | 0.710 | 0.782 | 0.794 | 0.743 | 0.723 | 0.781 | 0.725 | 0.714 | 0.746 | 0.693 |
| 1992 | 0.621 | 0.625 | 0.636 | 0.694 | 0.768 | 0.790 | 0.746 | 0.724 | 0.741 | 0.733 | 0.702 | 0.641 |
| 1993 | 0.641 | 0.660 | 0.675 | 0.701 | 0.726 | 0.724 | 0.669 | 0.661 | 0.649 | 0.666 | 0.622 | 0.543 |
| 1994 | 0.548 | 0.586 | 0.587 | 0.618 | 0.634 | 0.675 | 0.720 | 0.792 | 0.738 | 0.658 | 0.655 | 0.582 |
| 1995 | 0.606 | 0.596 | 0.631 | 0.709 | 0.763 | 0.771 | 0.699 | 0.690 | 0.678 | 0.614 | 0.586 | 0.609 |
| 1996 | 0.666 | 0.682 | 0.738 | 0.811 | 0.803 | 0.794 | 0.782 | 0.776 | 0.781 | 0.795 | 0.829 | 0.812 |
| 1997 | 0.818 | 0.770 | 0.729 | 0.738 | 0.784 | 0.830 | 0.790 | 0.844 | 0.818 | 0.723 | 0.714 | 0.654 |
| 1998 | 0.592 | 0.607 | 0.584 | 0.624 | 0.649 | 0.627 | 0.655 | 0.592 | 0.578 | 0.584 | 0.522 | 0.439 |
| 1999 | 0.480 | 0.472 | 0.537 | 0.677 | 0.685 | 0.665 | 0.760 | 0.780 | 0.807 | 0.774 | 0.782 | 0.838 |
| 2000 | 0.827 | 0.953 | 1.073 | 0.962 | 1.076 | 1.280 | 1.099 | 1.020 | 1.137 | 1.061 | 1.029 | 0.910 |
| 2001 | 1.019 | 1.034 | 0.971 | 1.170 | 1.331 | 1.108 | 0.873 | 1.037 | 1.154 | 0.824 | 0.684 | 0.653 |
| 2002 | 0.699 | 0.700 | 0.876 | 0.956 | 0.948 | 0.942 | 0.976 | 0.964 | 0.954 | 1.057 | 0.957 | 0.942 |
| 2003 | 1.023 | 1.202 | 1.195 | 1.051 | 1.031 | 1.068 | 1.096 | 1.216 | 1.124 | 1.081 | 1.010 | 0.983 |
| 2004 | 1.163 | 1.219 | 1.275 | 1.331 | 1.546 | 1.425 | 1.435 | 1.419 | 1.417 | 1.540 | 1.402 | 1.297 |
| 2005 | 1.393 | 1.446 | 1.642 | 1.790 | 1.621 | 1.725 | 1.802 | 2.079 | 2.409 | 2.194 | 1.658 | 1.716 |
| 2006 | 1.823 | 1.736 | 1.957 | 2.284 | 2.290 | 2.333 | 2.516 | 2.452 | 1.846 | 1.672 | 1.709 | 1.764 |
| 2007 | 1.661 | 1.742 | 2.029 | 2.323 | 2.676 | 2.509 | 2.492 | 2.294 | 2.316 | 2.207 | 2.527 | 2.425 |
| 2008 | 2.458 | 2.493 | 2.682 | 2.964 | 3.275 | 3.486 | 3.467 | 3.123 | 3.142 | 2.274 | 1.372 | 1.078 |
| 2009 | 1.263 | 1.340 | 1.428 | 1.484 | 1.750 | 2.057 | 1.880 | 2.002 | 1.849 | 1.958 | 2.034 | 2.015 |
| 2010 | 2.121 | 2.046 | 2.189 | 2.274 | W | W | W | W | W | W | W | W |
| 2011 | W | W | W | W | W | W | W | W | W | - | - | - |
| 2012 | - | - | - | - | - | - | - | - | - | - | - | - |
| 2013 | - | - | - | - | - | - | - | - | - | - | - | - |
| 2014 | - | - | - | - | - | - | - | - | - | - | - | - |
| 2015 | - | - | - | - | - | - | - | - | - | - | - | - |
| 2016 | - | - | - | - | - | - | - | - | - | - | - | - |
| 2017 | - | - | - | - | - | - | - | - | - | - | - | - |
| 2018 | - | - | - | - | - | - | - | - | - | - | - | - |
| 2019 | - | - | - | - | - | - | - | - | - | - | - | - |
| 2020 | - | - | - | - | - | - | - | - | - | - | - | - |
| 2021 | - | - | - | - | - | - | - | - | - | - | - | - |
| 2022 | - | - | - | |||||||||
| - = No Data Reported; -- = Not Applicable; NA = Not Available; W = Withheld to avoid disclosure of individual company data. |
| Release Date: 6/1/2022 |
| Next Release Date: TBD |