|
Download Data (XLS File) |
|
||||||||
|
||||||||
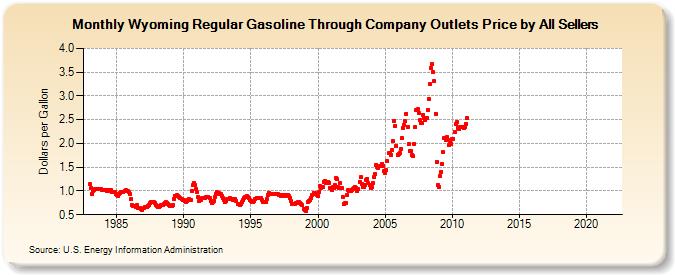
| Wyoming Regular Gasoline Through Company Outlets Price by All Sellers (Dollars per Gallon) | ||||||||
| Year | Jan | Feb | Mar | Apr | May | Jun | Jul | Aug | Sep | Oct | Nov | Dec |
|---|---|---|---|---|---|---|---|---|---|---|---|---|
| 1983 | 1.140 | 1.052 | 0.942 | 0.999 | 1.019 | 1.039 | 1.049 | 1.044 | 1.049 | 1.051 | 1.044 | 1.020 |
| 1984 | 1.010 | 1.011 | 1.016 | 1.007 | 1.010 | 1.018 | 1.001 | 1.014 | 0.980 | 0.987 | 0.982 | 0.933 |
| 1985 | 0.916 | 0.892 | 0.944 | 0.955 | 0.973 | 0.975 | 0.978 | 1.007 | 1.012 | 0.992 | 0.989 | 0.969 |
| 1986 | 0.931 | 0.824 | 0.700 | 0.683 | 0.683 | 0.672 | 0.696 | 0.650 | 0.634 | 0.633 | 0.610 | 0.601 |
| 1987 | 0.637 | 0.662 | 0.669 | 0.661 | 0.691 | 0.697 | 0.739 | 0.778 | 0.761 | 0.760 | 0.736 | 0.708 |
| 1988 | 0.677 | 0.653 | 0.652 | 0.673 | 0.694 | 0.713 | 0.729 | 0.749 | 0.764 | 0.752 | 0.729 | 0.703 |
| 1989 | 0.678 | 0.680 | 0.697 | 0.821 | 0.891 | 0.898 | 0.914 | 0.904 | 0.871 | 0.850 | 0.827 | 0.800 |
| 1990 | 0.806 | 0.784 | 0.777 | 0.795 | 0.804 | 0.829 | 0.819 | 1.007 | 1.119 | 1.172 | 1.134 | 1.045 |
| 1991 | 0.975 | 0.870 | 0.779 | 0.810 | 0.850 | 0.860 | 0.845 | 0.860 | 0.872 | 0.865 | 0.875 | 0.852 |
| 1992 | 0.786 | 0.746 | 0.763 | 0.797 | 0.873 | 0.943 | 0.972 | 0.959 | 0.946 | 0.926 | 0.896 | 0.846 |
| 1993 | 0.800 | 0.769 | 0.788 | 0.826 | 0.837 | 0.854 | 0.841 | 0.824 | 0.816 | 0.839 | 0.827 | 0.789 |
| 1994 | 0.730 | 0.721 | 0.708 | 0.716 | 0.758 | 0.802 | 0.848 | 0.877 | 0.896 | 0.872 | 0.849 | 0.808 |
| 1995 | 0.791 | 0.769 | 0.773 | 0.799 | 0.841 | 0.857 | 0.852 | 0.846 | 0.846 | 0.842 | 0.815 | 0.778 |
| 1996 | 0.770 | 0.769 | 0.823 | 0.915 | 0.967 | 0.943 | 0.930 | 0.926 | 0.935 | 0.927 | 0.934 | 0.933 |
| 1997 | 0.927 | 0.907 | 0.914 | 0.900 | 0.915 | 0.915 | 0.893 | 0.921 | 0.918 | 0.923 | 0.892 | 0.852 |
| 1998 | 0.787 | 0.728 | 0.720 | 0.734 | 0.747 | 0.753 | 0.761 | 0.758 | 0.745 | 0.728 | 0.703 | 0.630 |
| 1999 | 0.600 | 0.582 | 0.649 | 0.766 | 0.794 | 0.807 | 0.860 | 0.925 | 0.961 | 0.958 | 0.936 | 0.911 |
| 2000 | 0.904 | 0.984 | 1.104 | 1.066 | 1.088 | 1.192 | 1.213 | 1.166 | 1.172 | 1.191 | 1.175 | 1.069 |
| 2001 | 1.025 | 1.073 | 1.058 | 1.126 | 1.268 | 1.243 | 1.075 | 1.060 | 1.164 | 1.065 | 0.876 | 0.718 |
| 2002 | 0.740 | 0.744 | 0.921 | 1.011 | 0.997 | 0.992 | 1.026 | 1.050 | 1.059 | 1.086 | 1.064 | 0.995 |
| 2003 | 1.040 | 1.189 | 1.284 | 1.153 | 1.086 | 1.077 | 1.124 | 1.238 | 1.256 | 1.167 | 1.123 | 1.059 |
| 2004 | 1.092 | 1.172 | 1.284 | 1.358 | 1.549 | 1.507 | 1.481 | 1.517 | 1.516 | 1.568 | 1.535 | 1.417 |
| 2005 | 1.368 | 1.433 | 1.626 | 1.792 | 1.798 | 1.765 | 1.853 | 2.044 | 2.472 | 2.365 | 1.946 | 1.765 |
| 2006 | 1.782 | 1.804 | 1.884 | 2.118 | 2.330 | 2.394 | 2.472 | 2.625 | 2.350 | 1.979 | 1.849 | 1.844 |
| 2007 | 1.764 | 1.731 | 1.995 | 2.338 | 2.699 | 2.717 | 2.632 | 2.484 | 2.437 | 2.421 | 2.605 | 2.540 |
| 2008 | 2.493 | 2.525 | 2.713 | 2.936 | 3.241 | 3.577 | 3.664 | 3.501 | 3.306 | 2.628 | 1.617 | 1.124 |
| 2009 | 1.092 | 1.306 | 1.401 | 1.575 | 1.818 | 2.123 | 2.074 | 2.125 | 2.078 | 1.974 | 2.061 | 1.997 |
| 2010 | 2.086 | 2.101 | 2.251 | 2.401 | 2.441 | 2.330 | 2.313 | 2.352 | 2.351 | 2.337 | 2.320 | 2.349 |
| 2011 | 2.412 | 2.533 | - | - | - | - | - | - | - | - | - | - |
| 2012 | - | - | - | - | - | - | - | - | - | - | - | - |
| 2013 | - | - | - | - | - | - | - | - | - | - | - | - |
| 2014 | - | - | - | - | - | - | - | - | - | - | - | - |
| 2015 | - | - | - | - | - | - | - | - | - | - | - | - |
| 2016 | - | - | - | - | - | - | - | - | - | - | - | - |
| 2017 | - | - | - | - | - | - | - | - | - | - | - | - |
| 2018 | - | - | - | - | - | - | - | - | - | - | - | - |
| 2019 | - | - | - | - | - | - | - | - | - | - | - | - |
| 2020 | - | - | - | - | - | - | - | - | - | - | - | - |
| 2021 | - | - | - | - | - | - | - | - | - | - | - | - |
| 2022 | - | - | - | |||||||||
| - = No Data Reported; -- = Not Applicable; NA = Not Available; W = Withheld to avoid disclosure of individual company data. |
| Release Date: 6/1/2022 |
| Next Release Date: TBD |