|
Download Data (XLS File) |
|
||||||||
|
||||||||
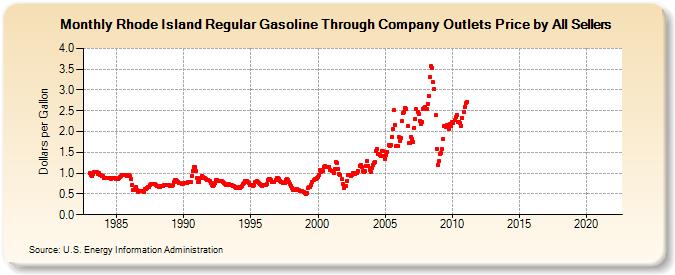
| Rhode Island Regular Gasoline Through Company Outlets Price by All Sellers (Dollars per Gallon) | ||||||||
| Year | Jan | Feb | Mar | Apr | May | Jun | Jul | Aug | Sep | Oct | Nov | Dec |
|---|---|---|---|---|---|---|---|---|---|---|---|---|
| 1983 | 1.007 | 0.966 | 0.936 | 0.991 | 1.017 | 1.027 | 1.034 | 0.990 | 0.993 | 0.954 | 0.953 | 0.934 |
| 1984 | 0.926 | 0.885 | 0.878 | 0.894 | 0.892 | 0.889 | 0.879 | 0.867 | 0.877 | 0.879 | 0.875 | 0.867 |
| 1985 | 0.853 | 0.854 | 0.876 | 0.909 | 0.929 | 0.950 | 0.963 | 0.953 | 0.957 | 0.941 | 0.957 | 0.961 |
| 1986 | 0.920 | 0.866 | 0.725 | 0.605 | 0.622 | 0.663 | 0.602 | 0.554 | 0.569 | 0.563 | 0.561 | 0.577 |
| 1987 | 0.553 | 0.612 | 0.624 | 0.646 | 0.658 | 0.675 | 0.716 | 0.747 | 0.737 | 0.727 | 0.731 | 0.719 |
| 1988 | 0.700 | 0.679 | 0.655 | 0.664 | 0.691 | 0.688 | 0.709 | 0.720 | 0.706 | 0.703 | 0.709 | 0.706 |
| 1989 | 0.697 | 0.693 | 0.708 | 0.777 | 0.824 | 0.831 | 0.819 | 0.779 | 0.763 | 0.755 | 0.740 | 0.750 |
| 1990 | 0.774 | 0.769 | 0.752 | 0.754 | 0.775 | 0.789 | 0.796 | 0.934 | 1.047 | 1.158 | 1.159 | 1.049 |
| 1991 | 0.884 | 0.788 | 0.797 | 0.879 | 0.931 | 0.909 | 0.872 | 0.882 | 0.865 | 0.828 | 0.839 | 0.807 |
| 1992 | 0.757 | 0.724 | 0.699 | 0.708 | 0.771 | 0.829 | 0.830 | 0.821 | 0.812 | 0.805 | 0.799 | 0.783 |
| 1993 | 0.763 | 0.745 | 0.722 | 0.720 | 0.732 | 0.724 | 0.718 | 0.707 | 0.689 | 0.693 | 0.675 | 0.636 |
| 1994 | 0.652 | 0.660 | 0.651 | 0.658 | 0.680 | 0.729 | 0.770 | 0.807 | 0.799 | 0.775 | 0.766 | 0.718 |
| 1995 | 0.708 | 0.706 | 0.695 | 0.716 | 0.784 | 0.807 | 0.786 | 0.760 | 0.742 | 0.723 | 0.686 | 0.715 |
| 1996 | 0.725 | 0.719 | 0.746 | 0.826 | 0.867 | 0.849 | 0.824 | 0.797 | 0.788 | 0.795 | 0.833 | 0.873 |
| 1997 | 0.875 | 0.857 | 0.818 | 0.795 | 0.779 | 0.773 | 0.763 | 0.843 | 0.862 | 0.823 | 0.781 | 0.735 |
| 1998 | 0.689 | 0.648 | 0.603 | 0.593 | 0.612 | 0.614 | 0.606 | 0.584 | 0.560 | 0.573 | 0.567 | 0.540 |
| 1999 | 0.517 | 0.492 | 0.530 | 0.640 | 0.664 | 0.656 | 0.711 | 0.779 | 0.828 | 0.852 | 0.861 | 0.883 |
| 2000 | 0.896 | 0.946 | 1.075 | 1.039 | 1.049 | 1.148 | 1.177 | 1.156 | 1.157 | 1.146 | 1.139 | 1.085 |
| 2001 | 1.046 | 1.040 | 1.001 | 1.097 | 1.272 | 1.249 | 1.094 | 0.976 | 0.950 | 0.852 | 0.732 | 0.652 |
| 2002 | 0.687 | 0.690 | 0.813 | 0.954 | 0.967 | 0.942 | 0.949 | 0.992 | 0.987 | 0.989 | 1.007 | 0.998 |
| 2003 | 1.048 | 1.174 | 1.207 | 1.142 | 1.050 | 1.027 | 1.044 | 1.176 | 1.294 | 1.180 | 1.083 | 1.039 |
| 2004 | 1.133 | 1.203 | 1.252 | 1.271 | 1.524 | 1.576 | 1.464 | 1.428 | 1.402 | 1.541 | 1.531 | 1.408 |
| 2005 | 1.349 | 1.430 | 1.515 | 1.681 | 1.656 | 1.667 | 1.875 | 2.057 | 2.510 | 2.158 | 1.651 | 1.647 |
| 2006 | 1.869 | 1.782 | 1.847 | 2.253 | 2.449 | 2.474 | 2.573 | 2.550 | 2.138 | 1.727 | 1.732 | 1.877 |
| 2007 | 1.815 | 1.740 | 2.092 | 2.307 | 2.537 | 2.463 | 2.433 | 2.265 | 2.181 | 2.230 | 2.549 | 2.574 |
| 2008 | 2.600 | 2.546 | 2.674 | 2.863 | 3.310 | 3.570 | 3.533 | 3.184 | 3.020 | 2.391 | 1.581 | 1.199 |
| 2009 | 1.283 | 1.466 | 1.482 | 1.574 | 1.827 | 2.144 | 2.101 | 2.157 | 2.133 | 2.069 | 2.172 | 2.143 |
| 2010 | 2.236 | 2.210 | 2.266 | 2.340 | 2.406 | 2.241 | 2.224 | 2.203 | 2.137 | 2.327 | 2.473 | 2.598 |
| 2011 | 2.675 | 2.720 | - | - | - | - | - | - | - | - | - | - |
| 2012 | - | - | - | - | - | - | - | - | - | - | - | - |
| 2013 | - | - | - | - | - | - | - | - | - | - | - | - |
| 2014 | - | - | - | - | - | - | - | - | - | - | - | - |
| 2015 | - | - | - | - | - | - | - | - | - | - | - | - |
| 2016 | - | - | - | - | - | - | - | - | - | - | - | - |
| 2017 | - | - | - | - | - | - | - | - | - | - | - | - |
| 2018 | - | - | - | - | - | - | - | - | - | - | - | - |
| 2019 | - | - | - | - | - | - | - | - | - | - | - | - |
| 2020 | - | - | - | - | - | - | - | - | - | - | - | - |
| 2021 | - | - | - | - | - | - | - | - | - | - | - | - |
| 2022 | - | - | - | |||||||||
| - = No Data Reported; -- = Not Applicable; NA = Not Available; W = Withheld to avoid disclosure of individual company data. |
| Release Date: 6/1/2022 |
| Next Release Date: TBD |