|
Download Data (XLS File) |
|
||||||||
|
||||||||
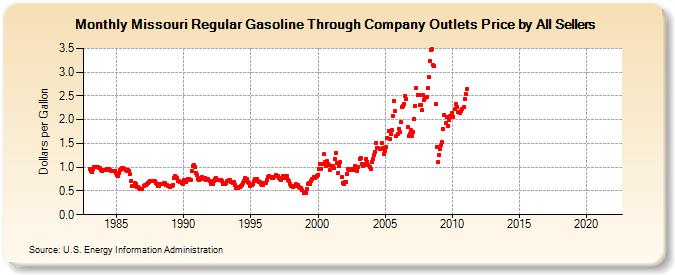
| Missouri Regular Gasoline Through Company Outlets Price by All Sellers (Dollars per Gallon) | ||||||||
| Year | Jan | Feb | Mar | Apr | May | Jun | Jul | Aug | Sep | Oct | Nov | Dec |
|---|---|---|---|---|---|---|---|---|---|---|---|---|
| 1983 | 0.969 | 0.928 | 0.900 | 0.964 | 0.997 | 0.997 | 1.003 | 0.994 | 0.991 | 0.979 | 0.950 | 0.926 |
| 1984 | 0.947 | 0.931 | 0.934 | 0.956 | 0.961 | 0.952 | 0.932 | 0.919 | 0.916 | 0.919 | 0.911 | 0.873 |
| 1985 | 0.834 | 0.821 | 0.868 | 0.948 | 0.960 | 0.975 | 0.977 | 0.966 | 0.946 | 0.929 | 0.941 | 0.922 |
| 1986 | 0.847 | 0.717 | 0.604 | 0.603 | 0.660 | 0.656 | 0.588 | 0.575 | 0.568 | 0.538 | 0.547 | 0.546 |
| 1987 | 0.603 | 0.616 | 0.623 | 0.647 | 0.661 | 0.690 | 0.705 | 0.712 | 0.705 | 0.704 | 0.702 | 0.668 |
| 1988 | 0.638 | 0.614 | 0.602 | 0.637 | 0.652 | 0.640 | 0.664 | 0.671 | 0.626 | 0.616 | 0.614 | 0.598 |
| 1989 | 0.586 | 0.599 | 0.630 | 0.782 | 0.813 | 0.794 | 0.771 | 0.704 | 0.709 | 0.696 | 0.661 | 0.648 |
| 1990 | 0.731 | 0.692 | 0.678 | 0.737 | 0.750 | 0.752 | 0.736 | 0.917 | 1.015 | 1.049 | 1.004 | 0.888 |
| 1991 | 0.838 | 0.756 | 0.733 | 0.775 | 0.798 | 0.759 | 0.743 | 0.783 | 0.740 | 0.726 | 0.746 | 0.700 |
| 1992 | 0.639 | 0.642 | 0.654 | 0.702 | 0.762 | 0.778 | 0.740 | 0.724 | 0.736 | 0.728 | 0.700 | 0.654 |
| 1993 | 0.646 | 0.654 | 0.669 | 0.702 | 0.729 | 0.721 | 0.686 | 0.678 | 0.665 | 0.683 | 0.631 | 0.554 |
| 1994 | 0.554 | 0.587 | 0.582 | 0.607 | 0.631 | 0.668 | 0.711 | 0.771 | 0.742 | 0.683 | 0.668 | 0.612 |
| 1995 | 0.619 | 0.618 | 0.647 | 0.703 | 0.755 | 0.753 | 0.706 | 0.691 | 0.684 | 0.644 | 0.617 | 0.633 |
| 1996 | 0.674 | 0.677 | 0.732 | 0.801 | 0.806 | 0.794 | 0.784 | 0.782 | 0.782 | 0.791 | 0.836 | 0.823 |
| 1997 | 0.819 | 0.780 | 0.746 | 0.740 | 0.780 | 0.815 | 0.782 | 0.824 | 0.808 | 0.732 | 0.709 | 0.655 |
| 1998 | 0.597 | 0.599 | 0.581 | 0.613 | 0.638 | 0.628 | 0.634 | 0.577 | 0.567 | 0.568 | 0.524 | 0.447 |
| 1999 | 0.479 | 0.466 | 0.544 | 0.644 | 0.661 | 0.656 | 0.717 | 0.760 | 0.795 | 0.771 | 0.787 | 0.821 |
| 2000 | 0.839 | 0.957 | 1.065 | 0.972 | 1.074 | 1.270 | 1.103 | 1.025 | 1.123 | 1.077 | 1.040 | 0.932 |
| 2001 | 1.023 | 1.021 | 0.976 | 1.168 | 1.309 | 1.094 | 0.878 | 1.024 | 1.102 | 0.796 | 0.670 | 0.637 |
| 2002 | 0.685 | 0.687 | 0.862 | 0.958 | 0.943 | 0.938 | 0.967 | 0.958 | 0.942 | 1.035 | 0.956 | 0.926 |
| 2003 | 1.005 | 1.180 | 1.190 | 1.059 | 1.019 | 1.041 | 1.060 | 1.176 | 1.117 | 1.055 | 0.996 | 0.966 |
| 2004 | 1.109 | 1.173 | 1.247 | 1.317 | 1.512 | 1.400 | 1.403 | 1.386 | 1.374 | 1.508 | 1.399 | 1.276 |
| 2005 | 1.350 | 1.428 | 1.617 | 1.752 | 1.603 | 1.692 | 1.784 | 2.084 | 2.390 | 2.177 | 1.661 | 1.699 |
| 2006 | 1.810 | 1.731 | 1.943 | 2.267 | 2.285 | 2.326 | 2.502 | 2.435 | 1.841 | 1.659 | 1.697 | 1.775 |
| 2007 | 1.646 | 1.734 | 2.019 | 2.298 | 2.668 | 2.520 | 2.511 | 2.303 | 2.312 | 2.211 | 2.512 | 2.414 |
| 2008 | 2.458 | 2.482 | 2.666 | 2.903 | 3.241 | 3.462 | 3.485 | 3.140 | 3.128 | 2.323 | 1.426 | 1.103 |
| 2009 | 1.263 | 1.389 | 1.464 | 1.523 | 1.800 | 2.097 | 1.925 | 2.049 | 1.876 | 2.003 | 2.081 | 2.057 |
| 2010 | 2.139 | 2.066 | 2.217 | 2.326 | 2.273 | 2.157 | 2.162 | 2.146 | 2.186 | 2.231 | 2.266 | 2.445 |
| 2011 | 2.535 | 2.636 | - | - | - | - | - | - | - | - | - | - |
| 2012 | - | - | - | - | - | - | - | - | - | - | - | - |
| 2013 | - | - | - | - | - | - | - | - | - | - | - | - |
| 2014 | - | - | - | - | - | - | - | - | - | - | - | - |
| 2015 | - | - | - | - | - | - | - | - | - | - | - | - |
| 2016 | - | - | - | - | - | - | - | - | - | - | - | - |
| 2017 | - | - | - | - | - | - | - | - | - | - | - | - |
| 2018 | - | - | - | - | - | - | - | - | - | - | - | - |
| 2019 | - | - | - | - | - | - | - | - | - | - | - | - |
| 2020 | - | - | - | - | - | - | - | - | - | - | - | - |
| 2021 | - | - | - | - | - | - | - | - | - | - | - | - |
| 2022 | - | - | - | |||||||||
| - = No Data Reported; -- = Not Applicable; NA = Not Available; W = Withheld to avoid disclosure of individual company data. |
| Release Date: 6/1/2022 |
| Next Release Date: TBD |