|
Download Data (XLS File) |
|
||||||||
|
||||||||
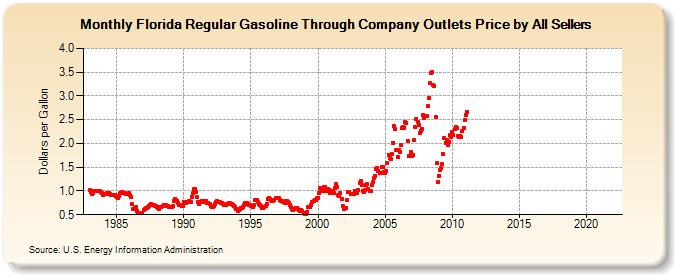
| Florida Regular Gasoline Through Company Outlets Price by All Sellers (Dollars per Gallon) | ||||||||
| Year | Jan | Feb | Mar | Apr | May | Jun | Jul | Aug | Sep | Oct | Nov | Dec |
|---|---|---|---|---|---|---|---|---|---|---|---|---|
| 1983 | 1.012 | 0.980 | 0.942 | 0.964 | 0.991 | 0.998 | 1.003 | 0.995 | 0.998 | 0.996 | 0.981 | 0.954 |
| 1984 | 0.922 | 0.929 | 0.938 | 0.953 | 0.943 | 0.963 | 0.929 | 0.919 | 0.923 | 0.925 | 0.912 | 0.898 |
| 1985 | 0.876 | 0.860 | 0.904 | 0.957 | 0.963 | 0.974 | 0.967 | 0.961 | 0.943 | 0.942 | 0.942 | 0.949 |
| 1986 | 0.920 | 0.873 | 0.718 | 0.629 | 0.633 | 0.652 | 0.578 | 0.540 | 0.527 | 0.542 | 0.534 | 0.536 |
| 1987 | 0.599 | 0.630 | 0.634 | 0.648 | 0.660 | 0.693 | 0.713 | 0.723 | 0.711 | 0.705 | 0.692 | 0.676 |
| 1988 | 0.655 | 0.634 | 0.627 | 0.654 | 0.671 | 0.675 | 0.696 | 0.708 | 0.703 | 0.691 | 0.683 | 0.665 |
| 1989 | 0.660 | 0.659 | 0.680 | 0.797 | 0.822 | 0.811 | 0.786 | 0.745 | 0.710 | 0.696 | 0.679 | 0.681 |
| 1990 | 0.765 | 0.767 | 0.754 | 0.761 | 0.774 | 0.784 | 0.771 | 0.882 | 0.949 | 1.044 | 1.041 | 0.975 |
| 1991 | 0.877 | 0.771 | 0.730 | 0.759 | 0.796 | 0.792 | 0.764 | 0.778 | 0.794 | 0.750 | 0.741 | 0.722 |
| 1992 | 0.685 | 0.665 | 0.662 | 0.683 | 0.735 | 0.777 | 0.784 | 0.768 | 0.760 | 0.755 | 0.749 | 0.732 |
| 1993 | 0.713 | 0.705 | 0.702 | 0.724 | 0.741 | 0.749 | 0.733 | 0.717 | 0.696 | 0.687 | 0.662 | 0.617 |
| 1994 | 0.588 | 0.606 | 0.616 | 0.634 | 0.648 | 0.666 | 0.694 | 0.740 | 0.739 | 0.724 | 0.714 | 0.699 |
| 1995 | 0.682 | 0.674 | 0.670 | 0.714 | 0.808 | 0.809 | 0.764 | 0.729 | 0.703 | 0.679 | 0.650 | 0.650 |
| 1996 | 0.672 | 0.682 | 0.735 | 0.823 | 0.853 | 0.827 | 0.809 | 0.790 | 0.791 | 0.808 | 0.844 | 0.858 |
| 1997 | 0.858 | 0.845 | 0.811 | 0.797 | 0.780 | 0.771 | 0.747 | 0.793 | 0.791 | 0.769 | 0.736 | 0.703 |
| 1998 | 0.662 | 0.629 | 0.604 | 0.615 | 0.636 | 0.632 | 0.621 | 0.594 | 0.578 | 0.589 | 0.573 | 0.533 |
| 1999 | 0.519 | 0.507 | 0.557 | 0.656 | 0.668 | 0.660 | 0.708 | 0.762 | 0.792 | 0.805 | 0.816 | 0.843 |
| 2000 | 0.857 | 0.948 | 1.063 | 0.992 | 1.009 | 1.074 | 1.074 | 1.002 | 1.050 | 1.037 | 1.016 | 0.962 |
| 2001 | 0.995 | 1.009 | 0.955 | 1.062 | 1.139 | 1.079 | 0.912 | 0.891 | 0.951 | 0.822 | 0.689 | 0.612 |
| 2002 | 0.633 | 0.645 | 0.801 | 0.982 | 0.969 | 0.931 | 0.926 | 0.927 | 0.934 | 1.007 | 0.994 | 0.953 |
| 2003 | 1.020 | 1.172 | 1.218 | 1.128 | 1.000 | 0.986 | 1.028 | 1.129 | 1.137 | 1.044 | 1.007 | 1.001 |
| 2004 | 1.128 | 1.184 | 1.268 | 1.319 | 1.462 | 1.485 | 1.422 | 1.383 | 1.374 | 1.504 | 1.513 | 1.396 |
| 2005 | 1.377 | 1.425 | 1.591 | 1.762 | 1.684 | 1.669 | 1.779 | 2.015 | 2.363 | 2.300 | 1.854 | 1.720 |
| 2006 | 1.871 | 1.821 | 1.962 | 2.326 | 2.347 | 2.331 | 2.444 | 2.440 | 2.058 | 1.733 | 1.738 | 1.825 |
| 2007 | 1.739 | 1.752 | 2.062 | 2.346 | 2.512 | 2.453 | 2.387 | 2.218 | 2.264 | 2.304 | 2.595 | 2.545 |
| 2008 | 2.571 | 2.571 | 2.783 | 2.953 | 3.270 | 3.487 | 3.500 | 3.230 | 3.211 | 2.554 | 1.587 | 1.196 |
| 2009 | 1.320 | 1.438 | 1.479 | 1.573 | 1.781 | 2.116 | 2.012 | 2.065 | 1.959 | 2.033 | 2.168 | 2.135 |
| 2010 | 2.239 | 2.167 | 2.299 | 2.350 | 2.319 | 2.154 | 2.130 | 2.155 | 2.140 | 2.261 | 2.325 | 2.486 |
| 2011 | 2.599 | 2.663 | - | - | - | - | - | - | - | - | - | - |
| 2012 | - | - | - | - | - | - | - | - | - | - | - | - |
| 2013 | - | - | - | - | - | - | - | - | - | - | - | - |
| 2014 | - | - | - | - | - | - | - | - | - | - | - | - |
| 2015 | - | - | - | - | - | - | - | - | - | - | - | - |
| 2016 | - | - | - | - | - | - | - | - | - | - | - | - |
| 2017 | - | - | - | - | - | - | - | - | - | - | - | - |
| 2018 | - | - | - | - | - | - | - | - | - | - | - | - |
| 2019 | - | - | - | - | - | - | - | - | - | - | - | - |
| 2020 | - | - | - | - | - | - | - | - | - | - | - | - |
| 2021 | - | - | - | - | - | - | - | - | - | - | - | - |
| 2022 | - | - | - | |||||||||
| - = No Data Reported; -- = Not Applicable; NA = Not Available; W = Withheld to avoid disclosure of individual company data. |
| Release Date: 6/1/2022 |
| Next Release Date: TBD |