|
Download Data (XLS File) |
|
||||||||
|
||||||||
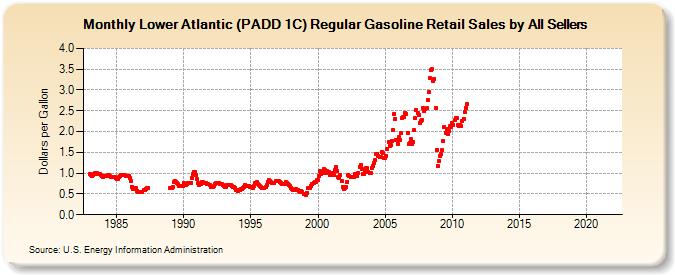
| Lower Atlantic (PADD 1C) Regular Gasoline Retail Sales by All Sellers (Dollars per Gallon) | ||||||||
| Year | Jan | Feb | Mar | Apr | May | Jun | Jul | Aug | Sep | Oct | Nov | Dec |
|---|---|---|---|---|---|---|---|---|---|---|---|---|
| 1983 | 0.991 | 0.956 | 0.926 | 0.958 | 0.988 | 0.993 | 0.994 | 0.987 | 0.983 | 0.975 | 0.958 | 0.933 |
| 1984 | 0.917 | 0.927 | 0.931 | 0.942 | 0.945 | 0.948 | 0.923 | 0.912 | 0.911 | 0.909 | 0.896 | 0.876 |
| 1985 | 0.859 | 0.858 | 0.899 | 0.941 | 0.951 | 0.950 | 0.950 | 0.946 | 0.931 | 0.932 | 0.942 | 0.940 |
| 1986 | 0.893 | 0.810 | 0.668 | 0.609 | 0.640 | 0.639 | 0.577 | 0.558 | 0.550 | 0.538 | 0.535 | 0.542 |
| 1987 | 0.594 | 0.606 | 0.619 | 0.634 | 0.641 | |||||||
| 1988 | NA | NA | NA | NA | NA | NA | NA | NA | NA | NA | NA | NA |
| 1989 | 0.638 | 0.637 | 0.668 | 0.785 | 0.811 | 0.796 | 0.770 | 0.729 | 0.702 | 0.695 | 0.679 | 0.684 |
| 1990 | 0.757 | 0.743 | 0.724 | 0.735 | 0.755 | 0.763 | 0.755 | 0.882 | 0.968 | 1.039 | 1.023 | 0.946 |
| 1991 | 0.852 | 0.760 | 0.725 | 0.747 | 0.790 | 0.784 | 0.760 | 0.774 | 0.772 | 0.744 | 0.742 | 0.716 |
| 1992 | 0.678 | 0.660 | 0.658 | 0.690 | 0.736 | 0.768 | 0.765 | 0.753 | 0.745 | 0.734 | 0.728 | 0.704 |
| 1993 | 0.686 | 0.675 | 0.678 | 0.707 | 0.724 | 0.724 | 0.710 | 0.692 | 0.674 | 0.667 | 0.643 | 0.600 |
| 1994 | 0.577 | 0.594 | 0.597 | 0.615 | 0.625 | 0.649 | 0.676 | 0.710 | 0.699 | 0.687 | 0.698 | 0.678 |
| 1995 | 0.663 | 0.655 | 0.649 | 0.698 | 0.772 | 0.776 | 0.739 | 0.704 | 0.683 | 0.661 | 0.633 | 0.632 |
| 1996 | 0.652 | 0.658 | 0.709 | 0.794 | 0.826 | 0.801 | 0.782 | 0.762 | 0.760 | 0.772 | 0.808 | 0.815 |
| 1997 | 0.817 | 0.802 | 0.778 | 0.762 | 0.749 | 0.740 | 0.728 | 0.775 | 0.770 | 0.743 | 0.715 | 0.682 |
| 1998 | 0.643 | 0.608 | 0.585 | 0.594 | 0.610 | 0.605 | 0.592 | 0.567 | 0.554 | 0.570 | 0.550 | 0.505 |
| 1999 | 0.492 | 0.477 | 0.533 | 0.634 | 0.644 | 0.638 | 0.688 | 0.742 | 0.774 | 0.778 | 0.796 | 0.824 |
| 2000 | 0.838 | 0.926 | 1.048 | 0.986 | 1.015 | 1.089 | 1.078 | 1.008 | 1.049 | 1.037 | 1.018 | 0.952 |
| 2001 | 0.987 | 1.002 | 0.947 | 1.071 | 1.141 | 1.063 | 0.902 | 0.894 | 0.957 | 0.810 | 0.674 | 0.616 |
| 2002 | 0.650 | 0.655 | 0.798 | 0.950 | 0.932 | 0.903 | 0.908 | 0.910 | 0.918 | 0.988 | 0.962 | 0.931 |
| 2003 | 1.009 | 1.154 | 1.191 | 1.088 | 0.979 | 0.979 | 1.022 | 1.117 | 1.117 | 1.032 | 0.999 | 0.995 |
| 2004 | 1.119 | 1.177 | 1.248 | 1.306 | 1.468 | 1.463 | 1.411 | 1.382 | 1.377 | 1.506 | 1.481 | 1.353 |
| 2005 | 1.364 | 1.419 | 1.590 | 1.755 | 1.653 | 1.667 | 1.780 | 2.026 | 2.434 | 2.310 | 1.793 | 1.703 |
| 2006 | 1.864 | 1.789 | 1.956 | 2.325 | 2.349 | 2.341 | 2.457 | 2.423 | 1.974 | 1.700 | 1.721 | 1.813 |
| 2007 | 1.707 | 1.739 | 2.037 | 2.324 | 2.529 | 2.455 | 2.397 | 2.214 | 2.256 | 2.282 | 2.558 | 2.496 |
| 2008 | 2.548 | 2.555 | 2.764 | 2.943 | 3.279 | 3.492 | 3.502 | 3.209 | 3.270 | 2.575 | 1.563 | 1.172 |
| 2009 | 1.296 | 1.418 | 1.463 | 1.545 | 1.782 | 2.099 | 1.975 | 2.056 | 1.946 | 2.013 | 2.127 | 2.100 |
| 2010 | 2.215 | 2.146 | 2.276 | 2.331 | 2.315 | 2.151 | 2.140 | 2.152 | 2.134 | 2.249 | 2.309 | 2.467 |
| 2011 | 2.575 | 2.657 | - | - | - | - | - | - | - | - | - | - |
| 2012 | - | - | - | - | - | - | - | - | - | - | - | - |
| 2013 | - | - | - | - | - | - | - | - | - | - | - | - |
| 2014 | - | - | - | - | - | - | - | - | - | - | - | - |
| 2015 | - | - | - | - | - | - | - | - | - | - | - | - |
| 2016 | - | - | - | - | - | - | - | - | - | - | - | - |
| 2017 | - | - | - | - | - | - | - | - | - | - | - | - |
| 2018 | - | - | - | - | - | - | - | - | - | - | - | - |
| 2019 | - | - | - | - | - | - | - | - | - | - | - | - |
| 2020 | - | - | - | - | - | - | - | - | - | - | - | - |
| 2021 | - | - | - | - | - | - | - | - | - | - | - | - |
| 2022 | - | - | - | |||||||||
| - = No Data Reported; -- = Not Applicable; NA = Not Available; W = Withheld to avoid disclosure of individual company data. |
| Release Date: 6/1/2022 |
| Next Release Date: TBD |