|
Download Data (XLS File) |
|
||||||||
|
||||||||
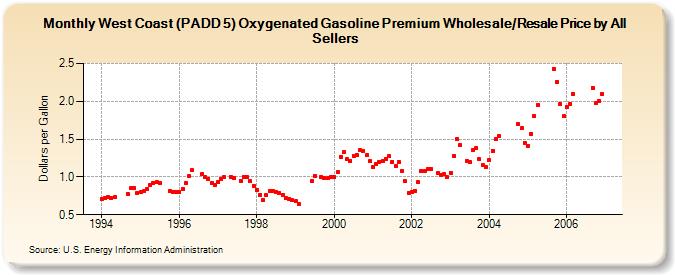
| West Coast (PADD 5) Oxygenated Gasoline Premium Wholesale/Resale Price by All Sellers (Dollars per Gallon) | ||||||||
| Year | Jan | Feb | Mar | Apr | May | Jun | Jul | Aug | Sep | Oct | Nov | Dec |
|---|---|---|---|---|---|---|---|---|---|---|---|---|
| 1994 | 0.713 | 0.718 | 0.730 | 0.722 | 0.728 | W | W | W | 0.776 | 0.849 | 0.851 | 0.790 |
| 1995 | 0.800 | 0.808 | 0.841 | 0.892 | 0.919 | 0.927 | 0.920 | NA | NA | 0.814 | 0.796 | 0.801 |
| 1996 | 0.797 | 0.837 | 0.917 | 1.011 | 1.087 | NA | NA | 1.033 | 0.999 | 0.973 | 0.923 | 0.894 |
| 1997 | 0.930 | 0.974 | 0.997 | NA | 1.005 | 0.979 | NA | 0.952 | 1.003 | 0.995 | 0.940 | 0.885 |
| 1998 | 0.832 | 0.765 | 0.701 | 0.755 | 0.811 | 0.811 | 0.802 | 0.790 | 0.761 | 0.716 | 0.712 | 0.693 |
| 1999 | 0.678 | 0.648 | NA | NA | W | 0.943 | 1.016 | W | 1.003 | 0.985 | 0.984 | 1.001 |
| 2000 | 1.003 | 1.061 | 1.269 | 1.323 | 1.232 | 1.212 | 1.281 | 1.296 | 1.356 | 1.341 | 1.284 | 1.204 |
| 2001 | 1.136 | 1.171 | 1.202 | 1.214 | 1.237 | 1.272 | 1.200 | 1.142 | 1.197 | 1.082 | 0.940 | 0.793 |
| 2002 | 0.800 | 0.820 | 0.929 | 1.075 | 1.082 | 1.102 | 1.106 | NA | 1.049 | 1.025 | 1.034 | 0.995 |
| 2003 | 1.056 | 1.275 | 1.498 | 1.419 | NA | 1.213 | 1.200 | 1.359 | 1.384 | 1.231 | 1.156 | 1.131 |
| 2004 | 1.220 | 1.343 | 1.495 | 1.538 | NA | NA | NA | NA | NA | 1.699 | 1.641 | 1.454 |
| 2005 | 1.415 | 1.571 | 1.800 | 1.952 | W | W | W | W | 2.427 | 2.258 | 1.960 | 1.802 |
| 2006 | 1.926 | 1.961 | 2.095 | NA | W | - | - | - | 2.180 | 1.973 | 1.999 | 2.102 |
| - = No Data Reported; -- = Not Applicable; NA = Not Available; W = Withheld to avoid disclosure of individual company data. |
| Release Date: 6/1/2022 |
| Next Release Date: TBD |