|
Download Data (XLS File) |
|
||||||||
|
||||||||
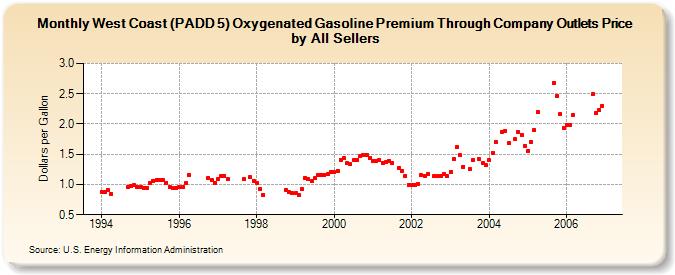
| West Coast (PADD 5) Oxygenated Gasoline Premium Through Company Outlets Price by All Sellers (Dollars per Gallon) | ||||||||
| Year | Jan | Feb | Mar | Apr | May | Jun | Jul | Aug | Sep | Oct | Nov | Dec |
|---|---|---|---|---|---|---|---|---|---|---|---|---|
| 1994 | 0.876 | 0.872 | 0.908 | 0.845 | W | W | W | W | 0.956 | 0.969 | 0.987 | 0.966 |
| 1995 | 0.958 | 0.946 | 0.947 | 1.022 | 1.062 | 1.079 | 1.082 | 1.075 | 1.026 | 0.956 | 0.935 | 0.935 |
| 1996 | 0.951 | 0.966 | 1.022 | 1.160 | NA | W | W | NA | NA | 1.113 | 1.072 | 1.030 |
| 1997 | 1.083 | 1.140 | 1.141 | 1.083 | NA | W | W | W | 1.090 | NA | 1.118 | 1.063 |
| 1998 | 1.024 | 0.929 | 0.830 | W | W | W | W | W | NA | 0.914 | 0.869 | 0.854 |
| 1999 | 0.856 | 0.820 | 0.923 | 1.113 | 1.083 | 1.051 | 1.102 | 1.150 | 1.155 | 1.153 | 1.169 | 1.205 |
| 2000 | 1.200 | 1.228 | 1.409 | 1.437 | 1.351 | 1.337 | 1.400 | 1.406 | 1.463 | 1.493 | 1.492 | 1.444 |
| 2001 | 1.390 | 1.389 | 1.407 | 1.359 | 1.369 | 1.396 | 1.356 | NA | 1.278 | 1.225 | 1.144 | 0.993 |
| 2002 | 0.985 | 0.993 | 1.012 | 1.149 | 1.140 | 1.171 | NA | 1.142 | 1.133 | 1.139 | 1.169 | 1.137 |
| 2003 | 1.210 | 1.428 | 1.613 | 1.482 | 1.297 | NA | 1.252 | 1.407 | NA | 1.420 | 1.362 | 1.314 |
| 2004 | 1.398 | 1.521 | 1.706 | NA | 1.874 | 1.890 | 1.680 | NA | 1.747 | 1.871 | 1.825 | 1.644 |
| 2005 | 1.561 | 1.699 | 1.901 | 2.199 | W | W | W | W | 2.682 | 2.463 | 2.160 | 1.933 |
| 2006 | 1.991 | 1.983 | 2.154 | W | W | W | W | W | 2.488 | 2.183 | 2.231 | 2.300 |
| - = No Data Reported; -- = Not Applicable; NA = Not Available; W = Withheld to avoid disclosure of individual company data. |
| Release Date: 6/1/2022 |
| Next Release Date: TBD |