|
Download Data (XLS File) |
|
||||||||
|
||||||||
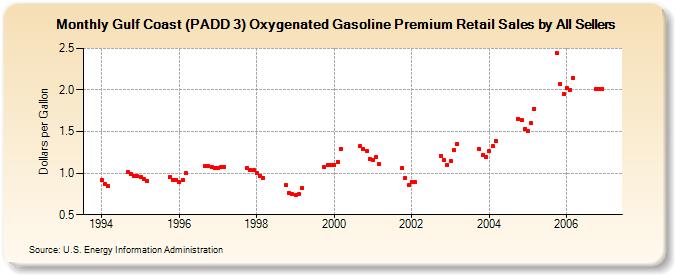
| Gulf Coast (PADD 3) Oxygenated Gasoline Premium Retail Sales by All Sellers (Dollars per Gallon) | ||||||||
| Year | Jan | Feb | Mar | Apr | May | Jun | Jul | Aug | Sep | Oct | Nov | Dec |
|---|---|---|---|---|---|---|---|---|---|---|---|---|
| 1994 | 0.916 | 0.864 | 0.843 | W | W | W | W | W | 1.013 | 0.985 | 0.962 | 0.966 |
| 1995 | 0.955 | 0.925 | 0.902 | W | W | W | W | W | NA | 0.952 | 0.915 | 0.917 |
| 1996 | 0.893 | 0.922 | 0.997 | NA | W | W | W | W | 1.082 | 1.086 | 1.076 | 1.064 |
| 1997 | 1.067 | 1.077 | 1.073 | NA | W | W | W | W | W | 1.067 | 1.042 | 1.034 |
| 1998 | 1.000 | 0.968 | 0.944 | W | W | W | W | - | W | 0.858 | 0.766 | 0.745 |
| 1999 | 0.733 | 0.746 | 0.822 | NA | W | W | NA | NA | W | 1.072 | 1.096 | 1.093 |
| 2000 | 1.100 | 1.139 | 1.294 | W | W | W | W | W | 1.321 | 1.296 | 1.272 | 1.172 |
| 2001 | 1.159 | 1.196 | 1.107 | W | W | W | W | W | W | 1.064 | 0.946 | 0.857 |
| 2002 | 0.895 | 0.891 | W | W | W | W | W | W | W | 1.212 | 1.152 | 1.101 |
| 2003 | 1.147 | 1.284 | 1.353 | W | W | W | W | W | W | 1.288 | 1.214 | 1.189 |
| 2004 | 1.262 | 1.323 | 1.390 | W | W | W | W | W | W | 1.652 | 1.643 | 1.533 |
| 2005 | 1.502 | 1.599 | 1.777 | W | W | W | W | W | W | 2.440 | 2.075 | 1.946 |
| 2006 | 2.024 | 2.005 | 2.144 | W | W | W | W | W | W | 2.014 | 2.009 | 2.015 |
| - = No Data Reported; -- = Not Applicable; NA = Not Available; W = Withheld to avoid disclosure of individual company data. |
| Release Date: 6/1/2022 |
| Next Release Date: TBD |