|
Download Data (XLS File) |
|
||||||||
|
||||||||
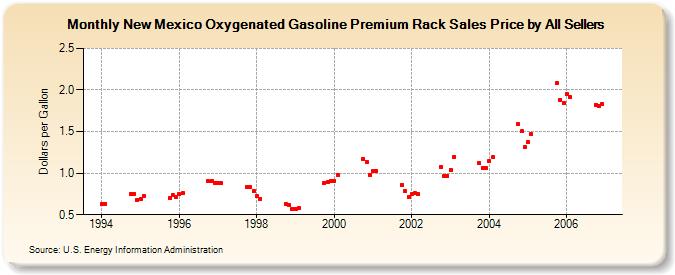
| New Mexico Oxygenated Gasoline Premium Rack Sales Price by All Sellers (Dollars per Gallon) | ||||||||
| Year | Jan | Feb | Mar | Apr | May | Jun | Jul | Aug | Sep | Oct | Nov | Dec |
|---|---|---|---|---|---|---|---|---|---|---|---|---|
| 1994 | 0.630 | 0.634 | W | W | - | - | - | - | - | 0.755 | 0.750 | 0.682 |
| 1995 | 0.688 | 0.724 | - | - | - | - | - | - | - | 0.702 | 0.737 | 0.719 |
| 1996 | 0.748 | 0.758 | W | - | - | - | - | - | - | 0.901 | 0.904 | 0.882 |
| 1997 | 0.878 | 0.877 | W | - | - | - | - | - | - | 0.838 | 0.832 | 0.786 |
| 1998 | 0.728 | 0.687 | - | - | - | - | - | - | - | 0.631 | 0.611 | 0.572 |
| 1999 | 0.572 | 0.577 | NA | W | - | - | - | - | - | 0.883 | 0.894 | 0.902 |
| 2000 | 0.908 | 0.978 | W | - | - | - | - | - | - | 1.168 | 1.138 | 0.972 |
| 2001 | 1.022 | 1.031 | W | - | - | - | - | - | - | 0.863 | 0.780 | 0.712 |
| 2002 | 0.744 | 0.756 | 0.750 | - | - | - | - | - | - | 1.078 | 0.971 | 0.969 |
| 2003 | 1.037 | 1.194 | - | - | - | - | - | - | - | 1.122 | 1.063 | 1.058 |
| 2004 | 1.144 | 1.190 | W | - | - | - | - | - | - | 1.585 | 1.502 | 1.315 |
| 2005 | 1.369 | 1.468 | - | - | - | - | - | - | - | 2.085 | 1.883 | 1.842 |
| 2006 | 1.946 | 1.914 | - | - | - | - | - | - | - | 1.823 | 1.810 | 1.834 |
| - = No Data Reported; -- = Not Applicable; NA = Not Available; W = Withheld to avoid disclosure of individual company data. |
| Release Date: 6/1/2022 |
| Next Release Date: TBD |