|
Download Data (XLS File) |
|
||||||||
|
||||||||
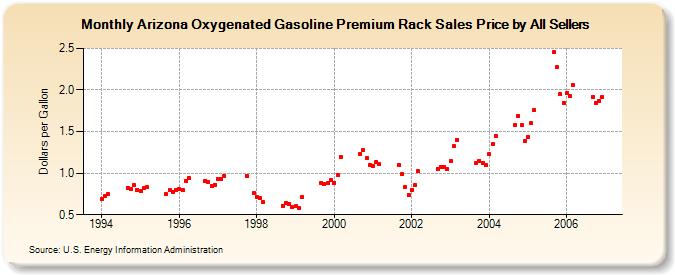
| Arizona Oxygenated Gasoline Premium Rack Sales Price by All Sellers (Dollars per Gallon) | ||||||||
| Year | Jan | Feb | Mar | Apr | May | Jun | Jul | Aug | Sep | Oct | Nov | Dec |
|---|---|---|---|---|---|---|---|---|---|---|---|---|
| 1994 | 0.693 | 0.728 | 0.749 | W | W | W | - | - | 0.827 | 0.809 | 0.853 | 0.803 |
| 1995 | 0.781 | 0.823 | 0.828 | W | - | - | - | - | 0.744 | 0.795 | 0.774 | 0.796 |
| 1996 | 0.808 | 0.795 | 0.908 | 0.943 | - | - | - | - | 0.909 | 0.899 | 0.851 | 0.862 |
| 1997 | 0.927 | 0.924 | 0.966 | W | - | - | - | - | W | 0.967 | NA | 0.761 |
| 1998 | 0.713 | 0.695 | 0.652 | W | - | - | W | W | 0.609 | 0.638 | 0.633 | 0.588 |
| 1999 | 0.599 | 0.581 | 0.708 | W | - | NA | - | - | 0.882 | 0.865 | 0.881 | 0.921 |
| 2000 | 0.885 | 0.978 | 1.198 | - | - | - | - | - | 1.234 | 1.275 | 1.186 | 1.102 |
| 2001 | 1.084 | 1.134 | 1.106 | - | - | - | - | - | 1.093 | 0.987 | 0.835 | 0.738 |
| 2002 | 0.799 | 0.853 | 1.022 | - | - | - | - | - | 1.050 | 1.076 | 1.072 | 1.048 |
| 2003 | 1.141 | 1.321 | 1.399 | - | - | - | - | - | 1.127 | 1.150 | 1.127 | 1.094 |
| 2004 | 1.225 | 1.353 | 1.448 | - | - | - | - | - | 1.578 | 1.692 | 1.578 | 1.384 |
| 2005 | 1.435 | 1.598 | 1.758 | - | - | - | - | - | 2.455 | 2.274 | 1.949 | 1.846 |
| 2006 | 1.960 | 1.930 | 2.056 | - | - | - | - | - | 1.918 | 1.845 | 1.866 | 1.912 |
| - = No Data Reported; -- = Not Applicable; NA = Not Available; W = Withheld to avoid disclosure of individual company data. |
| Release Date: 6/1/2022 |
| Next Release Date: TBD |