|
Download Data (XLS File) |
|
||||||||
|
||||||||
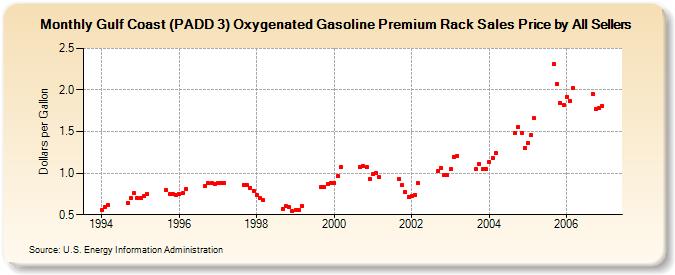
| Gulf Coast (PADD 3) Oxygenated Gasoline Premium Rack Sales Price by All Sellers (Dollars per Gallon) | ||||||||
| Year | Jan | Feb | Mar | Apr | May | Jun | Jul | Aug | Sep | Oct | Nov | Dec |
|---|---|---|---|---|---|---|---|---|---|---|---|---|
| 1994 | 0.562 | 0.596 | 0.612 | W | W | W | W | W | 0.638 | 0.699 | 0.757 | 0.699 |
| 1995 | 0.702 | 0.721 | 0.749 | W | - | - | - | W | 0.796 | 0.751 | 0.746 | 0.734 |
| 1996 | 0.748 | 0.756 | 0.812 | - | - | - | - | - | 0.841 | 0.877 | 0.883 | 0.870 |
| 1997 | 0.879 | 0.879 | 0.879 | NA | - | - | - | - | 0.862 | 0.853 | 0.825 | 0.789 |
| 1998 | 0.741 | 0.701 | 0.674 | - | - | - | - | - | 0.573 | 0.603 | 0.587 | 0.540 |
| 1999 | 0.555 | 0.551 | 0.610 | W | - | - | - | - | 0.835 | 0.828 | 0.866 | 0.879 |
| 2000 | 0.887 | 0.964 | 1.069 | W | - | - | - | - | 1.075 | 1.084 | 1.068 | 0.930 |
| 2001 | 0.992 | 1.003 | 0.948 | W | W | - | - | - | 0.931 | 0.860 | 0.772 | 0.710 |
| 2002 | 0.730 | 0.739 | 0.879 | W | - | - | - | - | 1.020 | 1.065 | 0.973 | 0.972 |
| 2003 | 1.045 | 1.196 | 1.212 | - | - | - | - | - | 1.046 | 1.108 | 1.050 | 1.049 |
| 2004 | 1.139 | 1.182 | 1.241 | - | - | - | - | - | 1.485 | 1.552 | 1.483 | 1.308 |
| 2005 | 1.363 | 1.455 | 1.658 | - | - | - | - | NA | 2.314 | 2.074 | 1.845 | 1.823 |
| 2006 | 1.921 | 1.870 | 2.021 | - | - | - | - | - | 1.955 | 1.772 | 1.781 | 1.808 |
| - = No Data Reported; -- = Not Applicable; NA = Not Available; W = Withheld to avoid disclosure of individual company data. |
| Release Date: 6/1/2022 |
| Next Release Date: TBD |