|
Download Data (XLS File) |
|
||||||||
|
||||||||
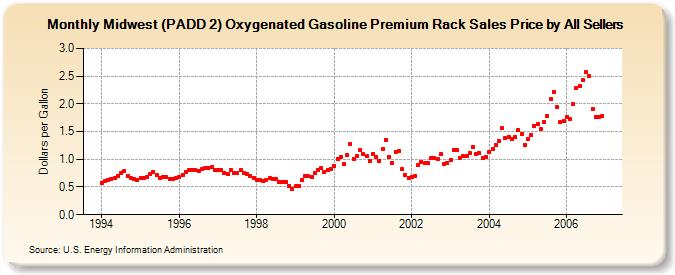
| Midwest (PADD 2) Oxygenated Gasoline Premium Rack Sales Price by All Sellers (Dollars per Gallon) | ||||||||
| Year | Jan | Feb | Mar | Apr | May | Jun | Jul | Aug | Sep | Oct | Nov | Dec |
|---|---|---|---|---|---|---|---|---|---|---|---|---|
| 1994 | 0.580 | 0.601 | 0.624 | 0.652 | 0.661 | 0.696 | 0.745 | 0.794 | 0.704 | 0.658 | 0.650 | 0.626 |
| 1995 | 0.659 | 0.668 | 0.679 | 0.734 | 0.767 | 0.711 | 0.669 | 0.677 | 0.684 | 0.645 | 0.652 | 0.669 |
| 1996 | 0.685 | 0.708 | 0.772 | 0.814 | 0.814 | 0.810 | 0.796 | 0.830 | 0.834 | 0.838 | 0.857 | 0.809 |
| 1997 | 0.811 | 0.801 | 0.759 | 0.738 | 0.807 | 0.757 | 0.746 | 0.805 | 0.754 | 0.728 | 0.707 | 0.667 |
| 1998 | 0.620 | 0.632 | 0.610 | 0.628 | 0.660 | 0.642 | 0.643 | 0.593 | 0.599 | 0.592 | 0.519 | 0.465 |
| 1999 | 0.515 | 0.524 | 0.620 | 0.702 | 0.692 | 0.688 | 0.753 | 0.807 | 0.836 | 0.774 | 0.806 | 0.825 |
| 2000 | 0.877 | 1.008 | 1.049 | 0.910 | 1.077 | 1.274 | 1.012 | 1.060 | 1.159 | 1.099 | 1.053 | 0.962 |
| 2001 | 1.102 | 1.041 | 0.976 | 1.178 | 1.345 | 1.048 | 0.938 | 1.140 | 1.141 | 0.817 | 0.708 | 0.660 |
| 2002 | 0.687 | 0.701 | 0.898 | 0.952 | 0.926 | 0.927 | 1.018 | 1.026 | 1.013 | 1.090 | 0.916 | 0.930 |
| 2003 | 0.987 | 1.176 | 1.161 | 1.029 | 1.051 | 1.059 | 1.105 | 1.228 | 1.096 | 1.107 | 1.026 | 1.042 |
| 2004 | 1.140 | 1.191 | 1.259 | 1.333 | 1.564 | 1.386 | 1.407 | 1.371 | 1.393 | 1.526 | 1.458 | 1.259 |
| 2005 | 1.364 | 1.433 | 1.607 | 1.630 | 1.545 | 1.678 | 1.779 | 2.084 | 2.216 | 1.937 | 1.672 | 1.691 |
| 2006 | 1.758 | 1.724 | 1.995 | 2.282 | 2.318 | 2.421 | 2.576 | 2.499 | 1.906 | 1.760 | 1.766 | 1.782 |
| - = No Data Reported; -- = Not Applicable; NA = Not Available; W = Withheld to avoid disclosure of individual company data. |
| Release Date: 6/1/2022 |
| Next Release Date: TBD |