|
Download Data (XLS File) |
|
||||||||
|
||||||||
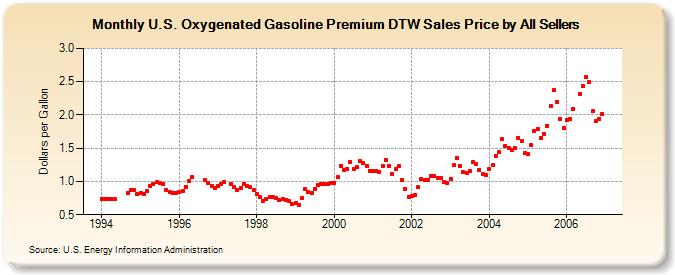
| U.S. Oxygenated Gasoline Premium DTW Sales Price by All Sellers (Dollars per Gallon) | ||||||||
| Year | Jan | Feb | Mar | Apr | May | Jun | Jul | Aug | Sep | Oct | Nov | Dec |
|---|---|---|---|---|---|---|---|---|---|---|---|---|
| 1994 | 0.735 | 0.736 | 0.736 | 0.741 | 0.732 | W | W | W | 0.832 | 0.867 | 0.871 | 0.814 |
| 1995 | 0.831 | 0.813 | 0.854 | 0.928 | 0.967 | 0.985 | 0.970 | 0.959 | 0.878 | 0.844 | 0.830 | 0.827 |
| 1996 | 0.834 | 0.855 | 0.924 | 1.013 | 1.074 | NA | NA | NA | 1.015 | 0.981 | 0.937 | 0.900 |
| 1997 | 0.928 | 0.968 | 0.993 | NA | 0.966 | 0.913 | 0.869 | 0.903 | 0.964 | 0.938 | 0.912 | 0.870 |
| 1998 | 0.810 | 0.762 | 0.710 | 0.743 | 0.772 | 0.765 | 0.752 | 0.719 | 0.733 | 0.722 | 0.703 | 0.668 |
| 1999 | 0.669 | 0.648 | 0.749 | 0.885 | 0.835 | 0.823 | 0.883 | 0.948 | 0.960 | 0.956 | 0.959 | 0.980 |
| 2000 | 0.976 | 1.061 | 1.231 | 1.170 | 1.182 | 1.285 | 1.184 | 1.211 | 1.303 | 1.278 | 1.236 | 1.155 |
| 2001 | 1.151 | 1.155 | 1.147 | 1.225 | 1.326 | 1.239 | 1.115 | 1.183 | 1.228 | 1.027 | 0.891 | 0.773 |
| 2002 | 0.787 | 0.797 | 0.915 | 1.030 | 1.016 | 1.024 | 1.078 | 1.084 | 1.052 | 1.047 | 0.999 | 0.982 |
| 2003 | 1.043 | 1.241 | 1.355 | 1.229 | 1.142 | 1.130 | 1.153 | 1.289 | 1.265 | 1.178 | 1.109 | 1.095 |
| 2004 | 1.185 | 1.244 | 1.384 | 1.439 | 1.633 | 1.536 | 1.510 | 1.475 | 1.499 | 1.660 | 1.602 | 1.425 |
| 2005 | 1.412 | 1.546 | 1.758 | 1.792 | 1.651 | 1.717 | 1.830 | 2.131 | 2.379 | 2.197 | 1.940 | 1.799 |
| 2006 | 1.931 | 1.936 | 2.095 | NA | 2.320 | 2.431 | 2.565 | 2.494 | 2.055 | 1.907 | 1.942 | 2.016 |
| - = No Data Reported; -- = Not Applicable; NA = Not Available; W = Withheld to avoid disclosure of individual company data. |
| Release Date: 6/1/2022 |
| Next Release Date: TBD |