|
Download Data (XLS File) |
|
||||||||
|
||||||||
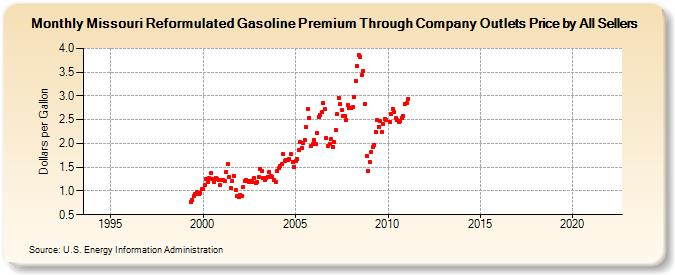
| Missouri Reformulated Gasoline Premium Through Company Outlets Price by All Sellers (Dollars per Gallon) | ||||||||
| Year | Jan | Feb | Mar | Apr | May | Jun | Jul | Aug | Sep | Oct | Nov | Dec |
|---|---|---|---|---|---|---|---|---|---|---|---|---|
| 1994 | - | - | - | - | - | - | - | - | - | - | - | - |
| 1995 | - | - | - | - | - | - | - | - | - | - | - | - |
| 1996 | - | - | - | - | - | - | - | - | - | - | - | - |
| 1997 | - | - | - | - | - | - | - | - | - | - | - | - |
| 1998 | - | - | - | - | - | - | - | - | - | - | - | - |
| 1999 | - | - | - | W | 0.769 | 0.810 | 0.893 | 0.931 | 0.973 | 0.930 | 0.955 | 1.035 |
| 2000 | 1.041 | 1.128 | 1.248 | 1.191 | 1.268 | 1.371 | 1.252 | 1.191 | 1.268 | 1.254 | 1.222 | 1.120 |
| 2001 | 1.227 | 1.227 | 1.203 | 1.399 | 1.564 | 1.300 | 1.067 | 1.204 | 1.325 | 1.020 | 0.904 | 0.867 |
| 2002 | 0.915 | 0.903 | 1.086 | 1.202 | 1.233 | 1.207 | 1.194 | 1.212 | 1.184 | 1.271 | 1.173 | 1.184 |
| 2003 | 1.287 | 1.468 | 1.418 | 1.283 | 1.237 | 1.279 | 1.304 | 1.394 | 1.314 | 1.300 | 1.226 | 1.197 |
| 2004 | 1.411 | 1.476 | 1.523 | 1.571 | 1.775 | 1.626 | 1.657 | 1.646 | 1.677 | 1.777 | 1.617 | 1.514 |
| 2005 | 1.623 | 1.665 | 1.859 | 2.022 | 1.895 | 2.008 | 2.073 | 2.347 | 2.717 | 2.527 | 1.939 | 1.988 |
| 2006 | 2.081 | 1.981 | 2.216 | 2.565 | 2.596 | 2.660 | 2.851 | 2.716 | 2.122 | 1.952 | 1.992 | 2.085 |
| 2007 | 1.923 | 2.032 | 2.289 | 2.616 | 2.964 | 2.827 | 2.712 | 2.576 | 2.575 | 2.497 | 2.808 | 2.737 |
| 2008 | 2.738 | 2.760 | 2.972 | 3.324 | 3.628 | 3.859 | 3.829 | 3.431 | 3.530 | 2.826 | 1.729 | 1.419 |
| 2009 | 1.610 | 1.821 | 1.917 | 1.966 | 2.244 | 2.497 | 2.356 | 2.465 | 2.245 | 2.409 | 2.505 | 2.497 |
| 2010 | NA | 2.460 | 2.616 | 2.735 | 2.660 | 2.528 | 2.492 | 2.454 | 2.470 | 2.537 | 2.571 | 2.820 |
| 2011 | 2.843 | 2.939 | - | - | - | - | - | - | - | - | - | - |
| 2012 | - | - | - | - | - | - | - | - | - | - | - | - |
| 2013 | - | - | - | - | - | - | - | - | - | - | - | - |
| 2014 | - | - | - | - | - | - | - | - | - | - | - | - |
| 2015 | - | - | - | - | - | - | - | - | - | - | - | - |
| 2016 | - | - | - | - | - | - | - | - | - | - | - | - |
| 2017 | - | - | - | - | - | - | - | - | - | - | - | - |
| 2018 | - | - | - | - | - | - | - | - | - | - | - | - |
| 2019 | - | - | - | - | - | - | - | - | - | - | - | - |
| 2020 | - | - | - | - | - | - | - | - | - | - | - | - |
| 2021 | - | - | - | - | - | - | - | - | - | - | - | - |
| 2022 | - | - | - | |||||||||
| - = No Data Reported; -- = Not Applicable; NA = Not Available; W = Withheld to avoid disclosure of individual company data. |
| Release Date: 6/1/2022 |
| Next Release Date: TBD |