|
Download Data (XLS File) |
|
||||||||
|
||||||||
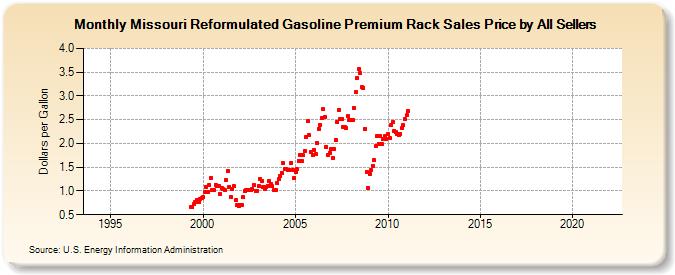
| Missouri Reformulated Gasoline Premium Rack Sales Price by All Sellers (Dollars per Gallon) | ||||||||
| Year | Jan | Feb | Mar | Apr | May | Jun | Jul | Aug | Sep | Oct | Nov | Dec |
|---|---|---|---|---|---|---|---|---|---|---|---|---|
| 1994 | - | - | - | - | - | - | - | - | - | - | - | - |
| 1995 | - | - | - | - | - | - | - | - | - | - | - | - |
| 1996 | - | - | - | - | - | - | - | - | - | - | - | - |
| 1997 | - | - | - | - | - | - | - | - | - | - | - | - |
| 1998 | - | - | - | - | - | - | - | - | - | - | - | - |
| 1999 | - | - | - | W | 0.664 | 0.657 | 0.725 | 0.770 | 0.814 | 0.771 | 0.838 | 0.850 |
| 2000 | 0.864 | 0.972 | 1.090 | 0.988 | 1.135 | 1.283 | 1.011 | 1.015 | 1.131 | 1.113 | 1.099 | 0.939 |
| 2001 | 1.067 | 1.040 | 1.014 | 1.224 | 1.424 | 1.086 | 0.874 | 1.038 | 1.098 | 0.803 | 0.694 | 0.676 |
| 2002 | 0.699 | 0.712 | 0.870 | 0.994 | 1.019 | 1.012 | 1.026 | 1.012 | 1.033 | 1.120 | 0.999 | 1.007 |
| 2003 | 1.099 | 1.251 | 1.206 | 1.073 | 1.050 | 1.089 | 1.105 | 1.205 | 1.136 | 1.098 | 1.027 | 1.019 |
| 2004 | 1.176 | 1.247 | 1.306 | 1.380 | 1.584 | 1.452 | 1.468 | 1.439 | 1.446 | 1.588 | 1.448 | 1.272 |
| 2005 | 1.396 | 1.458 | 1.639 | 1.763 | 1.639 | 1.751 | 1.845 | 2.145 | 2.464 | 2.170 | 1.820 | 1.749 |
| 2006 | 1.870 | 1.770 | 2.012 | 2.314 | 2.398 | 2.538 | 2.719 | 2.554 | 1.927 | 1.758 | 1.809 | 1.878 |
| 2007 | 1.695 | 1.878 | 2.075 | 2.460 | 2.709 | 2.515 | 2.517 | 2.352 | 2.336 | 2.321 | 2.575 | 2.488 |
| 2008 | 2.490 | 2.495 | 2.754 | 3.074 | 3.382 | 3.559 | 3.489 | 3.179 | 3.173 | 2.309 | 1.397 | 1.071 |
| 2009 | 1.351 | 1.440 | 1.535 | 1.643 | 1.936 | 2.159 | 1.996 | 2.164 | 1.986 | 2.086 | 2.150 | 2.096 |
| 2010 | 2.201 | 2.104 | 2.380 | 2.447 | 2.256 | 2.243 | 2.204 | 2.168 | 2.200 | 2.318 | 2.378 | 2.513 |
| 2011 | 2.592 | 2.677 | - | - | - | - | - | - | - | - | - | - |
| 2012 | - | - | - | - | - | - | - | - | - | - | - | - |
| 2013 | - | - | - | - | - | - | - | - | - | - | - | - |
| 2014 | - | - | - | - | - | - | - | - | - | - | - | - |
| 2015 | - | - | - | - | - | - | - | - | - | - | - | - |
| 2016 | - | - | - | - | - | - | - | - | - | - | - | - |
| 2017 | - | - | - | - | - | - | - | - | - | - | - | - |
| 2018 | - | - | - | - | - | - | - | - | - | - | - | - |
| 2019 | - | - | - | - | - | - | - | - | - | - | - | - |
| 2020 | - | - | - | - | - | - | - | - | - | - | - | - |
| 2021 | - | - | - | - | - | - | - | - | - | - | - | - |
| 2022 | - | - | - | |||||||||
| - = No Data Reported; -- = Not Applicable; NA = Not Available; W = Withheld to avoid disclosure of individual company data. |
| Release Date: 6/1/2022 |
| Next Release Date: TBD |