|
Download Data (XLS File) |
|
||||||||
|
||||||||
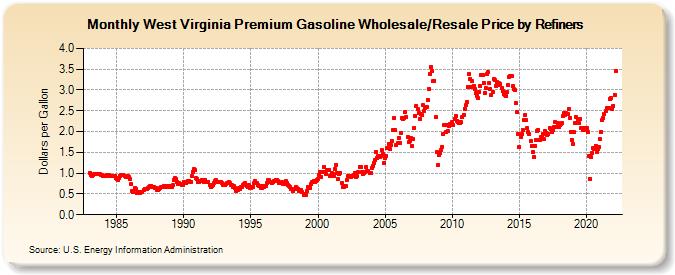
| West Virginia Premium Gasoline Wholesale/Resale Price by Refiners (Dollars per Gallon) | ||||||||
| Year | Jan | Feb | Mar | Apr | May | Jun | Jul | Aug | Sep | Oct | Nov | Dec |
|---|---|---|---|---|---|---|---|---|---|---|---|---|
| 1983 | 1.011 | 0.967 | 0.936 | 0.948 | 0.969 | 0.970 | 0.978 | 0.975 | 0.970 | 0.969 | 0.960 | 0.946 |
| 1984 | 0.933 | 0.939 | 0.943 | 0.950 | 0.952 | 0.945 | 0.930 | 0.921 | 0.927 | 0.928 | 0.920 | 0.877 |
| 1985 | 0.851 | 0.833 | 0.882 | 0.939 | 0.947 | 0.965 | 0.955 | 0.937 | 0.913 | 0.909 | 0.928 | 0.918 |
| 1986 | 0.850 | 0.732 | 0.573 | 0.557 | 0.641 | 0.616 | 0.528 | 0.536 | 0.549 | 0.530 | 0.540 | 0.547 |
| 1987 | 0.595 | 0.619 | 0.612 | 0.622 | 0.644 | 0.671 | 0.694 | 0.700 | 0.673 | 0.664 | 0.650 | 0.631 |
| 1988 | 0.601 | 0.602 | 0.608 | 0.645 | 0.665 | 0.664 | 0.700 | 0.700 | 0.662 | 0.662 | 0.684 | 0.662 |
| 1989 | 0.679 | 0.671 | 0.706 | 0.827 | 0.871 | 0.851 | 0.793 | 0.732 | 0.755 | 0.749 | 0.721 | 0.719 |
| 1990 | 0.798 | 0.766 | 0.752 | 0.787 | 0.814 | 0.814 | 0.788 | 0.940 | 1.033 | 1.091 | 1.074 | 0.874 |
| 1991 | 0.855 | 0.781 | 0.777 | 0.811 | 0.841 | 0.803 | 0.792 | 0.825 | 0.781 | 0.782 | 0.795 | 0.713 |
| 1992 | 0.674 | 0.694 | 0.725 | 0.761 | 0.813 | 0.825 | 0.793 | 0.786 | 0.798 | 0.786 | 0.756 | 0.718 |
| 1993 | 0.710 | 0.710 | 0.729 | 0.761 | 0.783 | 0.756 | 0.705 | 0.709 | 0.677 | 0.682 | 0.646 | 0.573 |
| 1994 | 0.605 | 0.636 | 0.611 | 0.668 | 0.670 | 0.705 | 0.734 | 0.762 | 0.681 | 0.676 | 0.715 | 0.650 |
| 1995 | 0.652 | 0.660 | 0.676 | 0.754 | 0.803 | 0.764 | 0.703 | 0.701 | 0.698 | 0.652 | 0.645 | 0.683 |
| 1996 | 0.677 | 0.689 | 0.751 | 0.827 | 0.840 | 0.792 | 0.783 | 0.762 | 0.782 | 0.802 | 0.845 | 0.831 |
| 1997 | 0.820 | 0.773 | 0.764 | 0.752 | 0.784 | 0.738 | 0.740 | 0.810 | 0.761 | 0.726 | 0.698 | 0.657 |
| 1998 | 0.618 | 0.612 | 0.581 | 0.618 | 0.662 | 0.645 | 0.628 | 0.578 | 0.582 | 0.604 | 0.546 | 0.486 |
| 1999 | 0.496 | 0.478 | 0.564 | 0.675 | 0.672 | 0.649 | 0.736 | 0.780 | 0.813 | 0.778 | 0.822 | 0.839 |
| 2000 | 0.865 | 0.956 | 1.032 | 0.903 | 1.036 | 1.154 | 1.017 | 0.991 | 1.087 | 1.069 | 1.071 | 0.921 |
| 2001 | 1.013 | 0.975 | 0.938 | 1.103 | 1.206 | 1.012 | 0.849 | 0.971 | 0.998 | 0.770 | 0.666 | 0.656 |
| 2002 | 0.685 | 0.679 | 0.834 | 0.935 | 0.922 | 0.910 | 0.929 | 0.928 | 0.944 | 1.005 | 0.915 | 0.924 |
| 2003 | 1.016 | 1.158 | 1.150 | 1.016 | 0.982 | 1.002 | 1.037 | 1.147 | 1.057 | 1.041 | 1.004 | 1.002 |
| 2004 | 1.121 | 1.183 | 1.251 | 1.317 | 1.516 | 1.374 | 1.409 | 1.393 | 1.411 | 1.546 | 1.449 | 1.248 |
| 2005 | 1.372 | 1.415 | 1.608 | 1.703 | 1.591 | 1.686 | 1.772 | 2.032 | 2.335 | 2.030 | 1.668 | 1.714 |
| 2006 | 1.856 | 1.728 | 1.970 | 2.331 | 2.299 | 2.315 | 2.466 | 2.350 | 1.865 | 1.739 | 1.781 | 1.852 |
| 2007 | 1.652 | 1.813 | 2.093 | 2.382 | 2.615 | 2.534 | 2.458 | 2.311 | 2.415 | 2.402 | 2.628 | 2.503 |
| 2008 | 2.573 | 2.599 | 2.769 | 3.021 | 3.393 | 3.556 | 3.451 | 3.217 | 3.226 | 2.342 | 1.498 | 1.195 |
| 2009 | 1.427 | 1.478 | 1.556 | 1.635 | 1.934 | 2.164 | 1.993 | 2.154 | 2.017 | 2.138 | 2.181 | 2.160 |
| 2010 | 2.232 | 2.152 | 2.300 | 2.383 | 2.262 | 2.225 | 2.212 | 2.197 | 2.218 | 2.346 | 2.410 | 2.550 |
| 2011 | 2.633 | 2.721 | 3.066 | 3.380 | 3.261 | 3.073 | 3.205 | 3.105 | 3.032 | 2.920 | 2.859 | 2.805 |
| 2012 | 2.956 | 3.098 | 3.362 | 3.356 | 3.175 | 2.936 | 3.036 | 3.373 | 3.426 | 3.166 | 3.015 | 2.873 |
| 2013 | 2.943 | 3.264 | 3.241 | 3.100 | 3.192 | 3.118 | 3.159 | 3.138 | 3.048 | 2.964 | 2.892 | 2.879 |
| 2014 | 2.861 | 2.956 | 3.111 | 3.323 | 3.339 | 3.325 | 3.091 | 3.012 | 2.999 | 2.680 | 2.466 | 1.948 |
| 2015 | 1.624 | 1.862 | 1.938 | 2.026 | 2.275 | 2.401 | 2.270 | 2.082 | 1.991 | 1.936 | 1.768 | 1.653 |
| 2016 | 1.511 | 1.388 | 1.659 | 1.804 | 2.005 | 2.039 | 1.808 | 1.869 | 1.876 | 1.941 | 1.812 | 2.009 |
| 2017 | 1.977 | 1.907 | 1.943 | 2.080 | 2.068 | 1.983 | 2.031 | 2.112 | 2.221 | 2.112 | 2.208 | 2.104 |
| 2018 | 2.160 | 2.173 | 2.211 | 2.370 | 2.444 | 2.403 | 2.443 | 2.414 | 2.531 | 2.328 | 1.988 | 1.803 |
| 2019 | 1.709 | 1.978 | 2.195 | 2.339 | 2.283 | 2.207 | 2.306 | 2.078 | NA | 2.035 | 2.096 | 2.046 |
| 2020 | 2.088 | 1.997 | 1.415 | 0.865 | 1.386 | 1.490 | 1.593 | 1.590 | 1.664 | 1.519 | 1.585 | 1.620 |
| 2021 | 1.811 | 1.998 | 2.270 | 2.326 | 2.416 | 2.496 | 2.560 | 2.563 | 2.558 | 2.787 | 2.812 | 2.540 |
| 2022 | 2.625 | 2.882 | 3.467 | |||||||||
| - = No Data Reported; -- = Not Applicable; NA = Not Available; W = Withheld to avoid disclosure of individual company data. |
| Release Date: 6/1/2022 |
| Next Release Date: TBD |