|
Download Data (XLS File) |
|
||||||||
|
||||||||
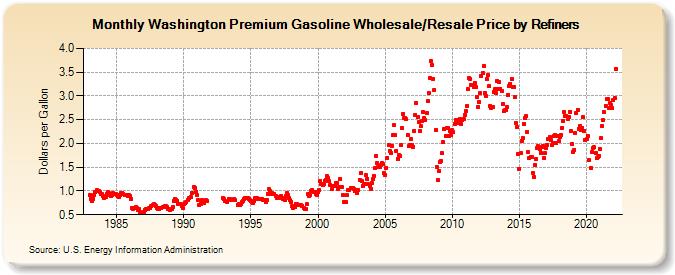
| Washington Premium Gasoline Wholesale/Resale Price by Refiners (Dollars per Gallon) | ||||||||
| Year | Jan | Feb | Mar | Apr | May | Jun | Jul | Aug | Sep | Oct | Nov | Dec |
|---|---|---|---|---|---|---|---|---|---|---|---|---|
| 1983 | 0.910 | 0.840 | 0.797 | 0.833 | 0.916 | 0.972 | 1.011 | 1.007 | 0.998 | 0.979 | 0.946 | 0.926 |
| 1984 | 0.894 | 0.861 | 0.874 | 0.946 | 0.968 | 0.947 | 0.916 | 0.902 | 0.925 | 0.947 | 0.946 | 0.943 |
| 1985 | 0.918 | 0.896 | 0.878 | 0.909 | 0.951 | 0.963 | 0.942 | 0.915 | 0.920 | 0.908 | 0.899 | 0.906 |
| 1986 | 0.893 | 0.830 | 0.638 | 0.618 | 0.648 | 0.664 | 0.632 | 0.606 | 0.611 | 0.555 | 0.539 | 0.535 |
| 1987 | 0.566 | 0.605 | 0.622 | 0.623 | 0.628 | 0.636 | 0.649 | 0.685 | 0.703 | 0.716 | 0.703 | 0.677 |
| 1988 | 0.649 | 0.630 | 0.618 | 0.633 | 0.651 | 0.658 | 0.666 | 0.674 | 0.677 | 0.655 | 0.629 | 0.618 |
| 1989 | 0.599 | 0.614 | 0.658 | 0.798 | 0.832 | 0.815 | 0.796 | 0.728 | 0.729 | 0.734 | 0.675 | 0.635 |
| 1990 | 0.725 | 0.739 | 0.761 | W | 0.815 | 0.849 | 0.873 | 0.962 | W | 1.088 | 1.064 | 0.982 |
| 1991 | 0.910 | 0.810 | 0.698 | 0.732 | 0.801 | 0.798 | 0.753 | 0.784 | 0.812 | 0.791 | W | W |
| 1992 | W | W | W | W | W | W | W | W | W | W | W | 0.850 |
| 1993 | 0.827 | 0.786 | W | 0.764 | 0.822 | 0.833 | 0.809 | W | W | 0.825 | 0.805 | W |
| 1994 | 0.713 | 0.725 | 0.714 | 0.735 | 0.762 | 0.791 | 0.825 | 0.850 | 0.856 | 0.844 | 0.839 | 0.813 |
| 1995 | 0.796 | 0.778 | 0.750 | 0.791 | 0.846 | 0.855 | 0.832 | 0.822 | 0.831 | 0.832 | 0.833 | 0.819 |
| 1996 | 0.803 | 0.768 | 0.805 | 0.939 | 1.031 | 1.003 | 0.939 | 0.947 | 0.939 | 0.931 | 0.886 | 0.852 |
| 1997 | 0.845 | 0.869 | 0.873 | 0.895 | 0.859 | 0.827 | 0.801 | 0.898 | 0.958 | 0.923 | 0.862 | 0.810 |
| 1998 | 0.768 | 0.690 | 0.646 | 0.671 | 0.735 | 0.718 | 0.713 | 0.704 | 0.705 | 0.702 | 0.690 | 0.648 |
| 1999 | 0.623 | 0.617 | 0.718 | 0.930 | 0.897 | 0.915 | 0.995 | 1.023 | 0.984 | 0.971 | 0.931 | 0.923 |
| 2000 | 0.968 | 1.018 | 1.207 | 1.155 | 1.130 | 1.139 | 1.215 | 1.235 | 1.305 | 1.265 | 1.204 | 1.134 |
| 2001 | 1.036 | 1.100 | 1.105 | 1.111 | 1.175 | 1.173 | 1.048 | 1.086 | 1.254 | 1.091 | 0.920 | 0.775 |
| 2002 | 0.769 | 0.765 | 0.908 | 1.029 | 1.021 | 1.058 | 1.066 | 1.062 | 1.044 | 0.989 | 1.011 | 0.967 |
| 2003 | 1.020 | 1.234 | 1.369 | 1.204 | 1.109 | 1.147 | 1.146 | 1.335 | 1.260 | 1.141 | 1.102 | 1.048 |
| 2004 | 1.160 | 1.243 | 1.318 | 1.480 | 1.736 | 1.588 | 1.512 | 1.513 | 1.546 | 1.598 | 1.560 | 1.380 |
| 2005 | 1.345 | 1.491 | 1.699 | 1.973 | 1.843 | 1.809 | 1.946 | 2.167 | 2.378 | 2.167 | 1.845 | 1.672 |
| 2006 | 1.761 | 1.732 | 1.965 | 2.325 | 2.627 | 2.530 | 2.533 | 2.505 | 2.187 | 1.943 | 1.975 | 2.089 |
| 2007 | 1.957 | 1.931 | 2.261 | 2.600 | 2.847 | 2.559 | 2.442 | 2.270 | 2.365 | 2.472 | 2.662 | 2.539 |
| 2008 | 2.488 | 2.641 | 2.888 | 3.053 | 3.381 | 3.733 | 3.649 | 3.358 | 3.128 | 2.287 | 1.499 | 1.224 |
| 2009 | 1.421 | 1.605 | 1.638 | 1.790 | 2.023 | 2.296 | 2.152 | 2.333 | 2.323 | 2.155 | 2.252 | 2.175 |
| 2010 | 2.278 | 2.244 | 2.416 | 2.496 | 2.426 | 2.423 | 2.500 | 2.514 | 2.404 | 2.489 | 2.524 | 2.604 |
| 2011 | 2.672 | 2.778 | 3.136 | 3.370 | 3.365 | 3.236 | 3.233 | 3.198 | 3.279 | 3.183 | 2.984 | 2.775 |
| 2012 | 2.872 | 3.064 | 3.419 | 3.478 | 3.633 | 3.063 | 3.005 | 3.351 | 3.439 | 3.206 | 2.786 | 2.745 |
| 2013 | 2.764 | 3.081 | 3.138 | 3.064 | 3.324 | 3.150 | 3.297 | 3.148 | 3.111 | 2.826 | 2.674 | 2.702 |
| 2014 | 2.699 | 2.761 | 3.029 | 3.207 | 3.255 | 3.361 | 3.195 | 3.186 | 2.969 | 2.429 | 2.336 | 1.787 |
| 2015 | 1.470 | 1.791 | 2.061 | 2.110 | 2.407 | 2.532 | 2.576 | 2.241 | 1.820 | 1.702 | 1.724 | 1.710 |
| 2016 | 1.380 | 1.288 | 1.556 | 1.667 | 1.906 | 1.939 | 1.879 | 1.807 | 1.933 | 1.947 | 1.700 | 1.789 |
| 2017 | 1.904 | 1.969 | 2.090 | 2.140 | 2.066 | 1.962 | 2.012 | 2.161 | 2.176 | 2.000 | 2.149 | 2.044 |
| 2018 | 2.132 | 2.173 | 2.335 | 2.482 | 2.658 | 2.587 | 2.581 | 2.515 | 2.564 | 2.670 | 2.256 | 1.991 |
| 2019 | 1.828 | 1.867 | 2.223 | 2.646 | 2.710 | 2.314 | 2.373 | 2.279 | 2.330 | 2.555 | 2.267 | 2.071 |
| 2020 | 2.090 | 2.155 | 1.649 | NA | 1.485 | 1.814 | 1.906 | 1.918 | 1.798 | 1.692 | 1.717 | 1.739 |
| 2021 | 1.889 | 2.112 | 2.375 | 2.483 | 2.653 | 2.798 | 2.935 | 2.945 | 2.745 | 2.848 | 2.808 | 2.737 |
| 2022 | 2.917 | 2.957 | 3.572 | |||||||||
| - = No Data Reported; -- = Not Applicable; NA = Not Available; W = Withheld to avoid disclosure of individual company data. |
| Release Date: 6/1/2022 |
| Next Release Date: TBD |