|
Download Data (XLS File) |
|
||||||||
|
||||||||
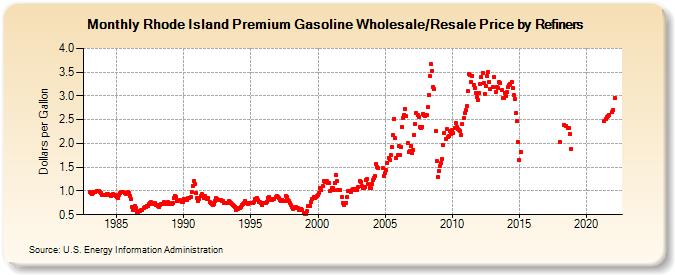
| Rhode Island Premium Gasoline Wholesale/Resale Price by Refiners (Dollars per Gallon) | ||||||||
| Year | Jan | Feb | Mar | Apr | May | Jun | Jul | Aug | Sep | Oct | Nov | Dec |
|---|---|---|---|---|---|---|---|---|---|---|---|---|
| 1983 | 0.988 | 0.956 | 0.929 | 0.947 | 0.978 | 0.978 | 1.004 | 1.003 | 0.999 | 0.979 | 0.956 | 0.923 |
| 1984 | 0.915 | 0.910 | 0.913 | 0.933 | 0.934 | 0.923 | 0.905 | 0.904 | 0.924 | 0.929 | 0.923 | 0.903 |
| 1985 | 0.870 | 0.857 | 0.917 | 0.954 | 0.970 | 0.982 | 0.980 | 0.949 | 0.941 | 0.954 | 0.976 | 0.953 |
| 1986 | 0.896 | 0.822 | 0.660 | 0.589 | 0.675 | 0.643 | 0.549 | 0.552 | 0.588 | 0.583 | 0.593 | 0.602 |
| 1987 | 0.647 | 0.662 | 0.669 | 0.684 | 0.688 | 0.717 | 0.757 | 0.760 | 0.732 | 0.728 | 0.746 | 0.712 |
| 1988 | 0.695 | 0.685 | 0.653 | 0.697 | 0.734 | 0.729 | 0.760 | 0.742 | 0.716 | 0.721 | 0.761 | 0.742 |
| 1989 | 0.733 | 0.732 | 0.750 | 0.849 | 0.902 | 0.872 | 0.792 | 0.781 | 0.793 | 0.803 | 0.771 | 0.767 |
| 1990 | 0.838 | 0.836 | 0.805 | 0.815 | 0.846 | 0.855 | 0.865 | 0.988 | 1.113 | 1.200 | 1.153 | 0.951 |
| 1991 | 0.853 | 0.791 | 0.829 | 0.888 | 0.930 | 0.886 | 0.847 | 0.885 | 0.860 | 0.838 | 0.847 | 0.761 |
| 1992 | 0.750 | 0.734 | 0.707 | 0.733 | 0.793 | 0.849 | 0.827 | 0.819 | 0.820 | 0.816 | 0.796 | 0.780 |
| 1993 | 0.757 | 0.747 | 0.736 | 0.754 | 0.780 | 0.770 | 0.737 | 0.730 | 0.712 | 0.691 | 0.671 | 0.608 |
| 1994 | 0.615 | 0.650 | 0.638 | 0.659 | 0.698 | 0.728 | 0.751 | 0.787 | 0.736 | 0.721 | 0.749 | 0.745 |
| 1995 | 0.751 | 0.749 | 0.736 | 0.774 | 0.841 | 0.847 | 0.802 | 0.771 | 0.766 | 0.737 | 0.714 | 0.753 |
| 1996 | 0.747 | 0.740 | 0.778 | 0.855 | 0.880 | 0.811 | 0.826 | 0.819 | 0.822 | 0.832 | 0.866 | 0.892 |
| 1997 | 0.883 | 0.845 | 0.820 | 0.790 | 0.820 | 0.789 | 0.793 | 0.892 | 0.875 | 0.812 | 0.781 | 0.739 |
| 1998 | 0.697 | 0.661 | 0.625 | 0.636 | 0.654 | 0.644 | 0.632 | 0.601 | 0.601 | 0.627 | 0.599 | 0.530 |
| 1999 | 0.519 | 0.506 | 0.570 | 0.677 | 0.693 | 0.684 | 0.761 | 0.823 | 0.874 | 0.858 | 0.877 | 0.892 |
| 2000 | 0.908 | 0.964 | 1.072 | 1.013 | 1.103 | 1.207 | 1.191 | 1.185 | 1.200 | 1.159 | 1.158 | 1.006 |
| 2001 | 1.058 | 1.061 | 1.011 | 1.164 | 1.335 | 1.203 | 1.024 | 1.019 | 1.011 | 0.870 | 0.755 | 0.705 |
| 2002 | 0.741 | 0.754 | 0.871 | 0.996 | 1.003 | 0.981 | 1.016 | 1.034 | 1.022 | 1.035 | 1.025 | 1.022 |
| 2003 | 1.083 | 1.203 | 1.197 | 1.096 | 1.061 | 1.069 | 1.090 | 1.234 | 1.248 | 1.138 | 1.071 | 1.058 |
| 2004 | 1.156 | 1.222 | 1.279 | 1.305 | 1.571 | 1.508 | 1.475 | W | W | NA | 1.487 | 1.314 |
| 2005 | 1.376 | 1.435 | 1.585 | 1.702 | 1.653 | 1.747 | 1.934 | 2.168 | 2.522 | 2.107 | 1.700 | 1.749 |
| 2006 | 1.936 | 1.758 | 1.927 | 2.353 | 2.539 | 2.595 | 2.727 | 2.570 | 2.019 | 1.816 | 1.841 | 1.953 |
| 2007 | 1.796 | 1.852 | 2.185 | 2.403 | 2.644 | 2.589 | 2.562 | 2.355 | 2.334 | 2.348 | 2.626 | 2.588 |
| 2008 | 2.584 | 2.593 | 2.759 | 3.009 | 3.418 | 3.669 | 3.531 | 3.184 | 3.142 | 2.259 | 1.629 | 1.296 |
| 2009 | 1.415 | 1.527 | 1.587 | 1.680 | 1.974 | 2.219 | 2.093 | 2.294 | 2.131 | 2.158 | 2.256 | 2.207 |
| 2010 | 2.279 | 2.212 | 2.334 | 2.431 | 2.346 | 2.303 | 2.290 | 2.255 | 2.180 | 2.405 | 2.526 | 2.635 |
| 2011 | 2.694 | 2.790 | 3.096 | 3.456 | 3.430 | 3.291 | 3.418 | 3.239 | 3.164 | 3.062 | 2.972 | 2.924 |
| 2012 | 3.063 | 3.246 | 3.394 | 3.490 | 3.281 | 3.036 | 3.200 | 3.418 | 3.502 | 3.294 | 3.147 | W |
| 2013 | 3.183 | 3.396 | W | 3.090 | 3.193 | 3.157 | 3.295 | 3.262 | 3.120 | 2.947 | 2.957 | 3.062 |
| 2014 | 2.995 | 3.084 | 3.183 | 3.238 | 3.250 | 3.298 | 3.169 | 3.017 | 2.940 | 2.640 | 2.476 | 2.029 |
| 2015 | 1.648 | 1.823 | W | W | W | W | W | W | W | W | W | W |
| 2016 | W | W | W | W | W | W | W | W | W | W | W | W |
| 2017 | W | W | W | W | W | W | W | W | W | W | W | W |
| 2018 | 2.038 | W | W | W | 2.394 | W | 2.372 | 2.328 | 2.325 | 2.208 | 1.884 | W |
| 2019 | W | W | W | W | W | W | W | W | W | W | W | W |
| 2020 | W | W | W | W | W | W | W | W | W | W | W | W |
| 2021 | W | W | W | W | 2.468 | 2.514 | 2.550 | 2.570 | 2.597 | W | W | 2.659 |
| 2022 | 2.713 | 2.953 | W | |||||||||
| - = No Data Reported; -- = Not Applicable; NA = Not Available; W = Withheld to avoid disclosure of individual company data. |
| Release Date: 6/1/2022 |
| Next Release Date: TBD |