|
Download Data (XLS File) |
|
||||||||
|
||||||||
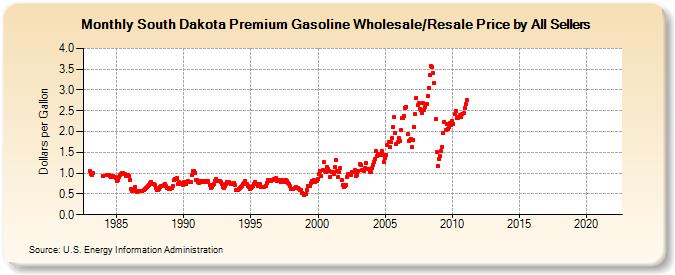
| South Dakota Premium Gasoline Wholesale/Resale Price by All Sellers (Dollars per Gallon) | ||||||||
| Year | Jan | Feb | Mar | Apr | May | Jun | Jul | Aug | Sep | Oct | Nov | Dec |
|---|---|---|---|---|---|---|---|---|---|---|---|---|
| 1983 | 1.056 | 0.982 | 0.957 | 0.998 | W | W | W | W | W | W | W | W |
| 1984 | 0.940 | W | W | 0.951 | 0.963 | 0.953 | 0.930 | 0.919 | 0.930 | 0.926 | 0.910 | 0.881 |
| 1985 | 0.818 | 0.837 | 0.901 | 0.954 | 0.980 | 0.997 | 0.997 | 0.986 | 0.931 | W | 0.954 | 0.929 |
| 1986 | 0.845 | 0.617 | 0.562 | 0.596 | 0.659 | 0.578 | 0.545 | 0.572 | 0.562 | 0.568 | 0.569 | 0.559 |
| 1987 | 0.586 | 0.624 | 0.646 | 0.662 | 0.690 | 0.723 | 0.761 | 0.788 | 0.747 | 0.732 | 0.722 | 0.631 |
| 1988 | 0.596 | 0.598 | 0.612 | 0.663 | 0.694 | 0.700 | 0.717 | 0.739 | 0.685 | 0.646 | 0.644 | 0.620 |
| 1989 | 0.630 | 0.645 | 0.685 | 0.824 | 0.864 | 0.867 | 0.875 | 0.748 | 0.776 | 0.760 | 0.734 | 0.712 |
| 1990 | 0.775 | 0.748 | 0.749 | 0.778 | 0.800 | 0.791 | 0.777 | 0.959 | 1.052 | 1.052 | 1.015 | 0.826 |
| 1991 | 0.826 | 0.775 | 0.770 | 0.814 | 0.820 | 0.788 | 0.796 | 0.820 | 0.775 | 0.776 | 0.808 | 0.709 |
| 1992 | 0.652 | 0.671 | 0.711 | 0.748 | 0.811 | 0.855 | 0.820 | 0.804 | 0.811 | 0.781 | 0.729 | 0.660 |
| 1993 | 0.651 | 0.696 | 0.744 | 0.790 | 0.797 | 0.771 | 0.729 | 0.733 | 0.750 | 0.765 | 0.704 | 0.593 |
| 1994 | 0.601 | 0.621 | 0.635 | 0.675 | 0.698 | 0.730 | 0.772 | 0.821 | 0.729 | 0.682 | 0.672 | 0.626 |
| 1995 | 0.645 | 0.670 | 0.690 | 0.743 | 0.791 | 0.750 | 0.701 | 0.718 | 0.727 | 0.665 | 0.657 | 0.656 |
| 1996 | 0.673 | 0.694 | 0.764 | 0.841 | 0.829 | 0.812 | 0.807 | 0.844 | 0.842 | 0.850 | 0.873 | 0.813 |
| 1997 | 0.817 | 0.826 | 0.801 | 0.785 | 0.833 | 0.804 | 0.793 | 0.842 | 0.803 | 0.765 | 0.731 | 0.679 |
| 1998 | 0.628 | 0.614 | 0.611 | 0.639 | 0.662 | 0.650 | 0.653 | 0.615 | 0.588 | 0.589 | 0.529 | 0.471 |
| 1999 | 0.501 | 0.507 | 0.601 | 0.698 | 0.691 | 0.685 | 0.751 | 0.816 | 0.835 | 0.792 | 0.809 | 0.816 |
| 2000 | 0.848 | 0.977 | 1.058 | 0.932 | 1.066 | 1.273 | 1.054 | 1.024 | 1.143 | 1.094 | 1.060 | 0.916 |
| 2001 | 1.022 | 1.016 | 0.974 | 1.149 | 1.320 | 1.061 | 0.915 | 1.037 | 1.125 | 0.827 | 0.712 | 0.671 |
| 2002 | 0.698 | 0.719 | 0.914 | 0.981 | 0.968 | 0.964 | 1.018 | 1.028 | 1.026 | 1.068 | 0.932 | 0.962 |
| 2003 | 1.047 | 1.209 | 1.206 | 1.066 | 1.069 | 1.061 | 1.127 | 1.249 | 1.103 | 1.109 | 1.031 | 1.033 |
| 2004 | 1.116 | 1.192 | 1.269 | 1.334 | 1.525 | 1.412 | 1.461 | 1.448 | 1.438 | 1.533 | 1.447 | 1.268 |
| 2005 | 1.364 | 1.440 | 1.668 | 1.749 | 1.639 | 1.738 | 1.835 | 2.111 | 2.340 | 1.969 | 1.693 | 1.744 |
| 2006 | 1.837 | 1.766 | 2.026 | 2.314 | 2.326 | 2.375 | 2.567 | 2.601 | 1.938 | 1.780 | 1.800 | 1.829 |
| 2007 | 1.628 | 1.805 | 2.113 | 2.413 | 2.815 | 2.627 | 2.675 | 2.540 | 2.508 | 2.448 | 2.678 | 2.520 |
| 2008 | 2.593 | 2.672 | 2.854 | 3.049 | 3.359 | 3.571 | 3.550 | 3.403 | 3.164 | 2.290 | 1.499 | 1.167 |
| 2009 | 1.349 | 1.423 | 1.530 | 1.634 | 1.960 | 2.237 | 2.048 | 2.193 | 2.069 | 2.116 | 2.196 | 2.154 |
| 2010 | 2.256 | 2.192 | 2.419 | 2.506 | 2.334 | 2.334 | 2.362 | 2.388 | 2.343 | 2.417 | 2.440 | 2.555 |
| 2011 | 2.662 | 2.765 | - | - | - | - | - | - | - | - | - | - |
| 2012 | - | - | - | - | - | - | - | - | - | - | - | - |
| 2013 | - | - | - | - | - | - | - | - | - | - | - | - |
| 2014 | - | - | - | - | - | - | - | - | - | - | - | - |
| 2015 | - | - | - | - | - | - | - | - | - | - | - | - |
| 2016 | - | - | - | - | - | - | - | - | - | - | - | - |
| 2017 | - | - | - | - | - | - | - | - | - | - | - | - |
| 2018 | - | - | - | - | - | - | - | - | - | - | - | - |
| 2019 | - | - | - | - | - | - | - | - | - | - | - | - |
| 2020 | - | - | - | - | - | - | - | - | - | - | - | - |
| 2021 | - | - | - | - | - | - | - | - | - | - | - | - |
| 2022 | - | - | - | |||||||||
| - = No Data Reported; -- = Not Applicable; NA = Not Available; W = Withheld to avoid disclosure of individual company data. |
| Release Date: 6/1/2022 |
| Next Release Date: TBD |